Here’s Craig Tysall’s entry for Power BI Challenge 5. @Craig, would you like to share how you built this dashboard and what your inspiration is in building it?
Here is the link:
Enterprise DNA CH04 Optical Data
To learn about the real-life scenario presented for the challenge, be sure to click on the image below.

Nice work on this one Craig. Great to have you digging into some of these challenges and bringing in your expertise to the forum.
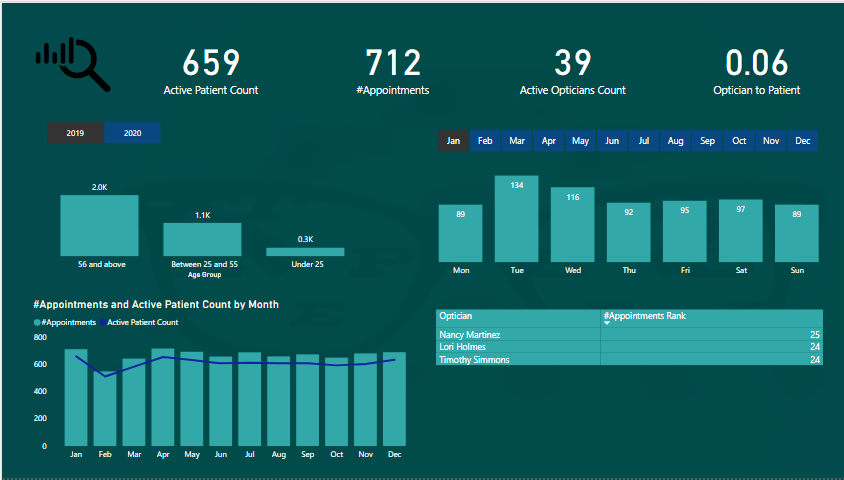
I actually really like your report design here. I think that it’s effective in it simplicity. You haven’t gone with the standard ideas that I usually have advised in many previous pieces of content around report design, especially with things like titles and grades etc , But I actually really do like this. It’s as I say, simple, intuitive and effective.
Sometimes when I look at some of the more recent submissions, you can actually get a little bit overcrowded in how you visualise things, so I like this reminder that keeping things to a minimum and showcasing exactly what a user has asked for is sometimes as equally as important.
Maybe one of the only other things that I would’ve add here from visualisation perspective it’s just a bit of a contrast in the background. Maybe breaking out some areas of your report with some different shades of the existing background. I feel like that maybe would draw users eyes to different segments of the analysis more effectively.
I’m interested around how you went about this, how are you built your model and formula, and if you had anything unique to share here.
Sam