Here’s Abu Bakar N. Alvi’s entry for Power BI Challenge 5. @Alvi, would you like to share how you built this dashboard and what your inspiration is in building it?
I can see that you’ve thought a lot about the design of the reports and to me it looks really professional. You can see that a lot of effort has gone into aligning borders, grids, visuals etc. All of these little things add up.
I also really like your colour scheme and the how it adds to the design of the report.
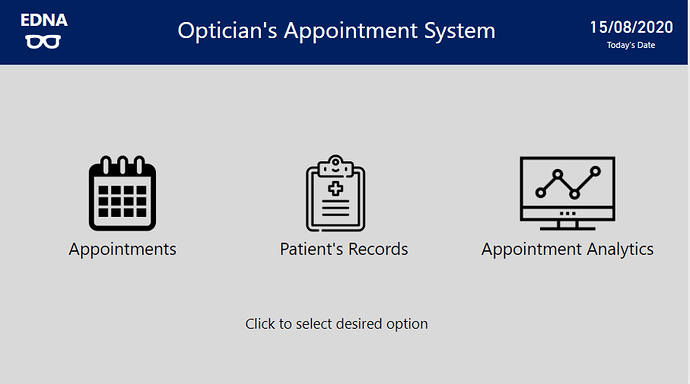
This to me as a real analytical solution. Something I like to explain to all beginner Power BI users. Your not just creating add hoc analysis you can build a full on application. And I feel like in this example you’ve really demonstrated that well. Especially with the navigation features you’ve included.
Thank you @sam.mckay for the appreciation and kind words.
I have always tried to use the guiding principles from your videos in my submissions and I am already feeling that my skills (DAX, visualizations, presentation) are improving with each challenge submission. I try to focus on the major questions asked in the challenge and try to present a clean and less cluttered solution, to the best of my abilities.
Thank you for your comments and the appreciation gives me a lot of confidence.