Here’s Paul’s entry for Power BI Challenge 19. @Paul.Gerber, feel free to add other details of your work.
Here’s how Paul described it:
Hello, eDNA community. So this is my third challenge in a row and each time I’m a little more excited about doing this. I want to thank Federico for leading this group now and I look forward to the next challenge; if time permits.
For this challenge, I wanted to take a different approach and practice what I have learned by reading the book called Storytelling with Data and the follow-up book to that with practice sets. So I went with a dark background and a mix of blues/purples and reds and yellows. More like pomegranate and buttercup to be exact. Overall, I did a makeover of the dashboard at least a few times not quite convincing of the layout.
I started using PowerPoint to create a lot of my designs and backgrounds with specific fonts that would be appealing but not “busy”.
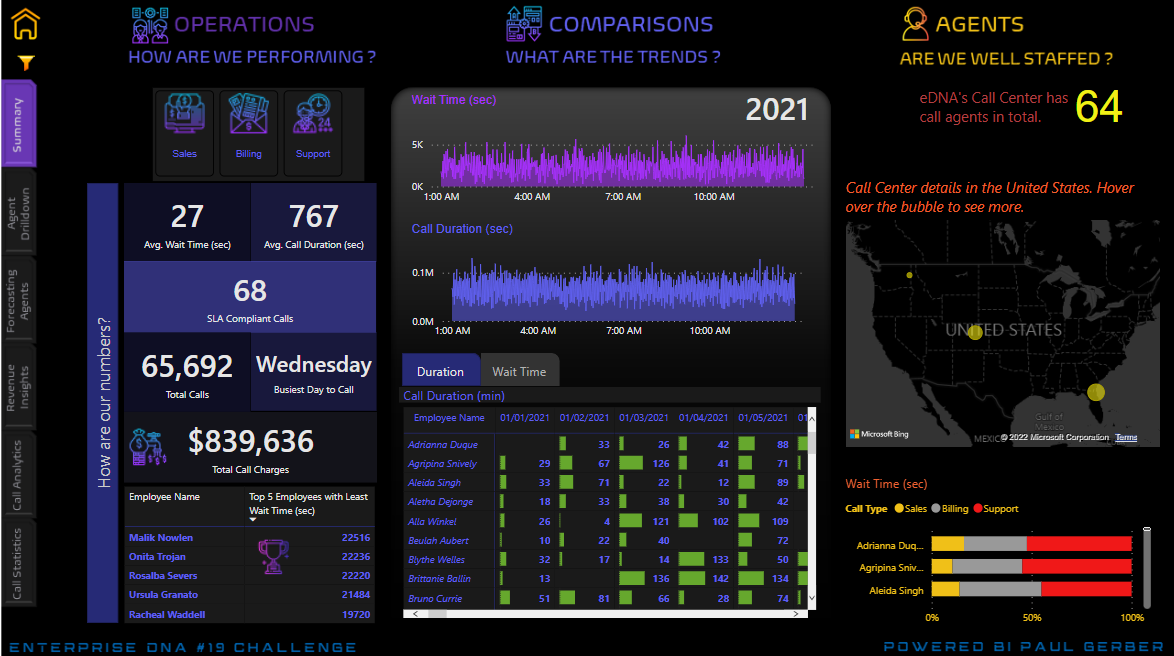
The first page called the Summary is just that; it summarizes operations, comparisons, and then general information about the call agents. I have also, toward the end of wrapping up the challenge, made use of quite a few techniques after watching Data Visualization with Alex B. I made use of tooltips and bookmarks. Even some pages look like they have a bunch of information and they might, using tooltips and bookmarks helps reduce real estate but still provides information without leaving the current page.
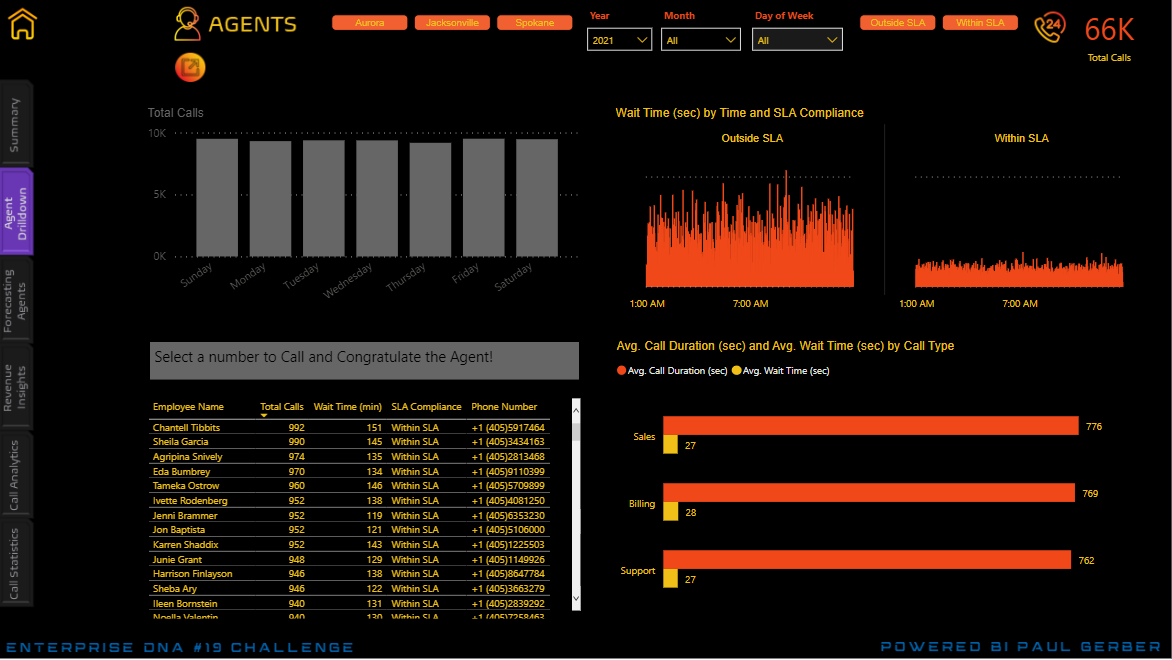
The second page is called Agent Drilldown. This page digs into the depths of which agents were in SLA Compliance along with how many calls were made. On this page, I added the bonus that Pascal described in his video. That was really cool !!
I used a drill-down by xViz but I need a Pro License so their message pops up. But I like using a hierarchy tree when it is necessary. I think using it helps the end-user see everything broken out that’s easy to interpret.
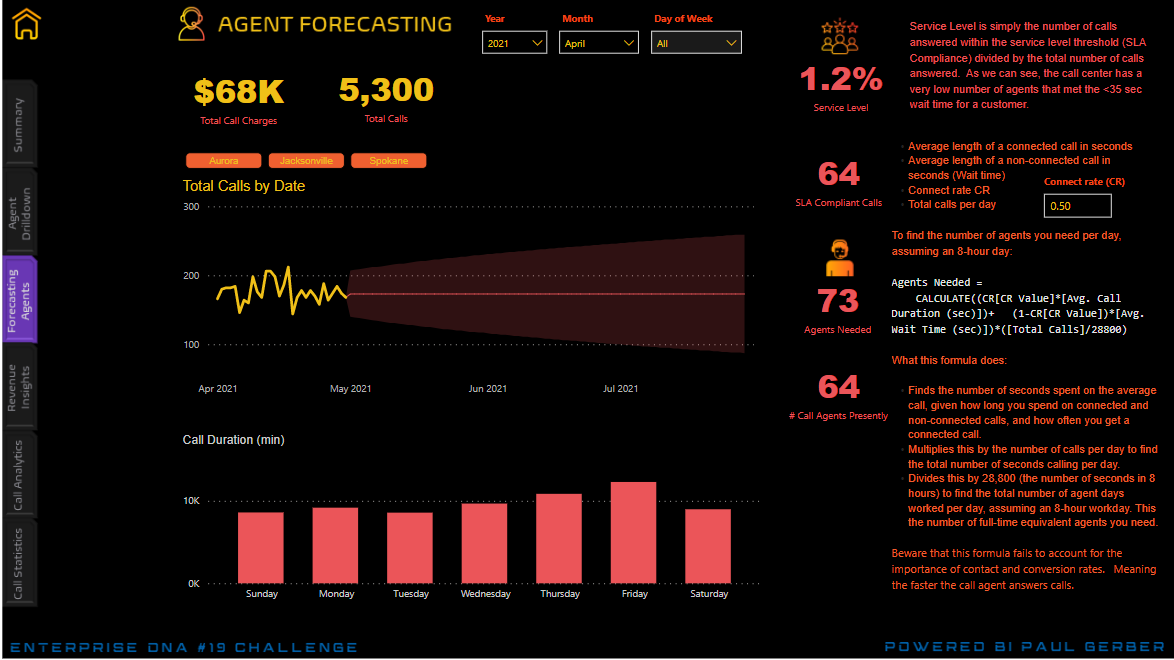
Forecasting Agents. Well, why not? I did some research on call centers and the metrics they use. One important one is
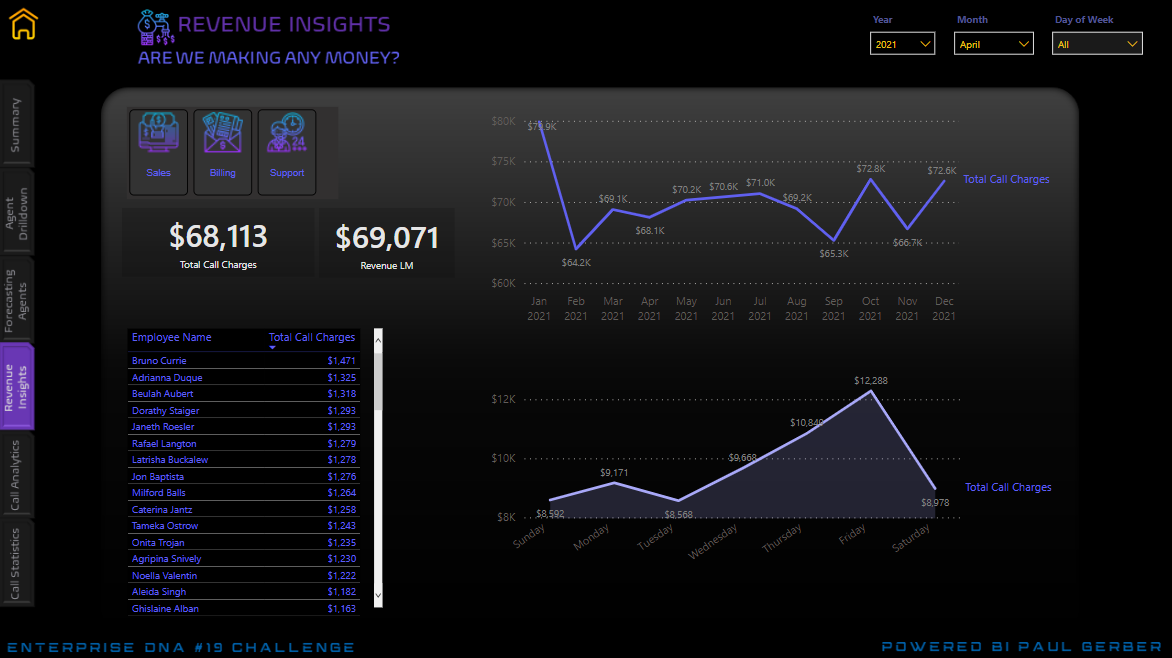
do we have enough help?" I put together a little write-up on this page explaining Service Level and wrote an equation in DAX to calculate the number of call agents needed based on the number of total calls that came into the call center. For example, In the month of April 2021, they had 1,908 calls in Jacksonville. They have 23 agents presently but based on the wait time and duration of the calls, they really needed 27 agents to lessen the burden on the agents and all the calls coming into the center. This is based on the connect rate (CR). But this challenge had flat data and unrealistic wait times. I’ve never experienced being on hold for less than 35 seconds. More so it’s usually 3 minutes minimum. But anyway, I hope you find this page useful.Next is Revenue Insights. Did we make $$? That’s the question. Of course, as expected, December and January are the busiest months because of holidays and gadgets breaking maybe hence the number of calls to Tech Support. Friday is also the busiest day.
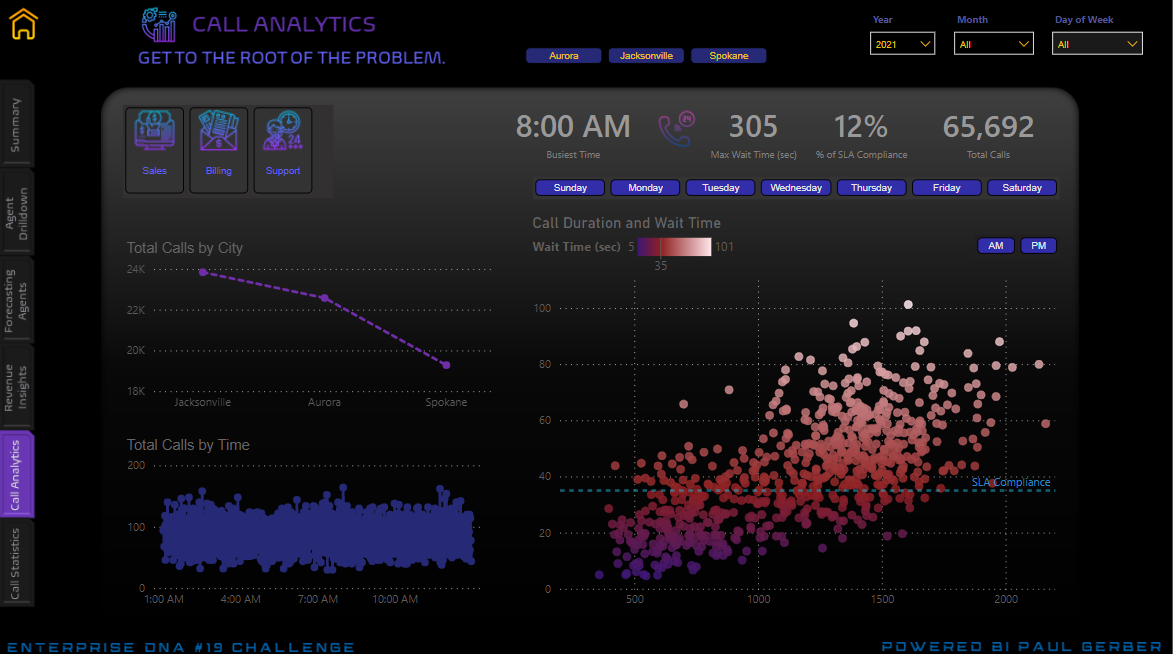
Then we have Call Analytics and next Call Statistics. I tried using Python this time to see if I get some intriguing results but the good data I think wasn’t there for this. Bummer. I found some useful visuals that could do the job just fine this time. Oddly, the call center gets a lot of calls from 1a to 10a. But in the evening it tapers off; again the data or maybe that’s business.
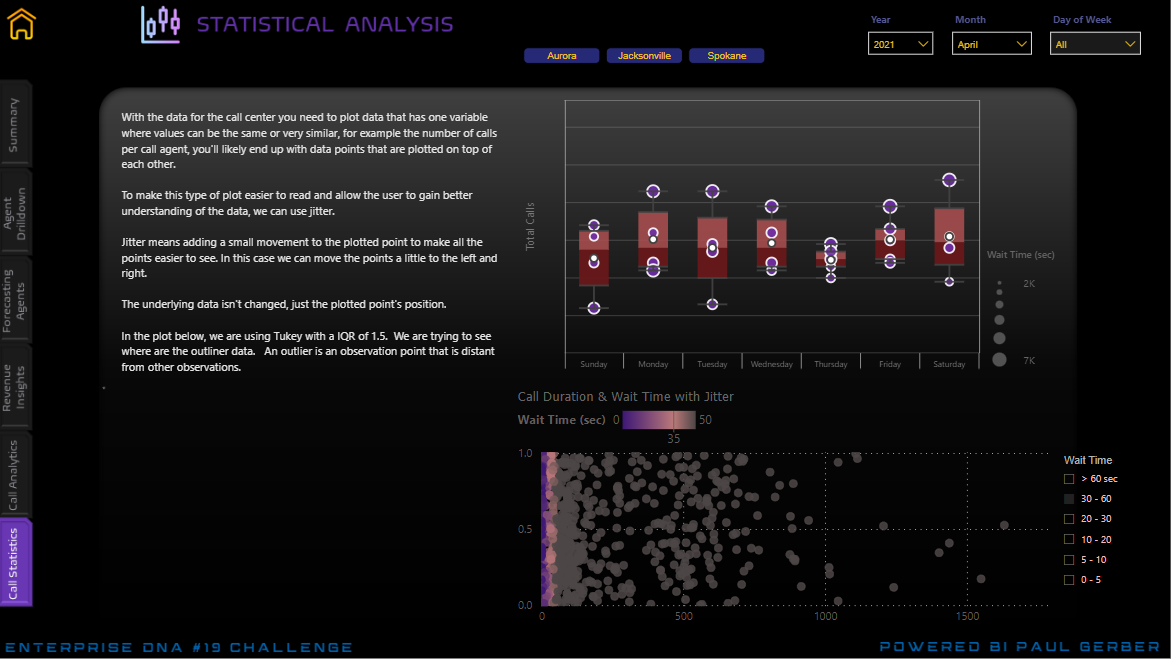
I used scatter, box and whisker and scatter with jitter added just to figure out if I had outliers. I do and it’s a strange grouping. For the first time, I brought in some statistical analysis but using the Tukey method and IQR. Still learning all of that so don’t ask for a dissertation yet!
In conclusion, I used different techniques in this challenge and broaden my skills from what I’ve been reading and courses I continue to take. Oh, I almost forgot, I hid some Easter eggs in the report. Nothing eye-popping just little notes. See if you find them all.
Enjoy!
Paul
Here’s the link to the report:
To learn about the real-life scenario presented for the challenge, be sure to click on the image below.
