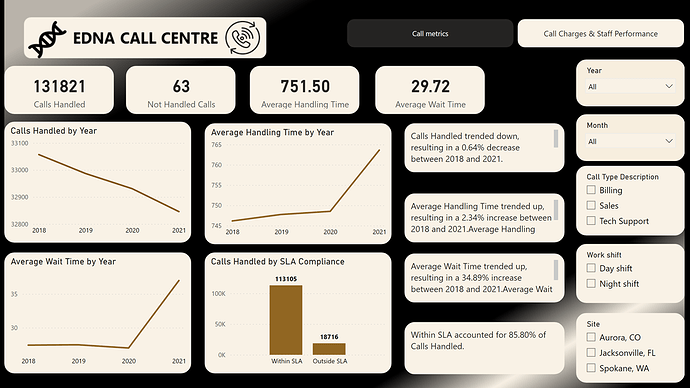
Here’s Josimar’s entry for Power BI Challenge 19. @Josimar_Biosse, feel free to add other details of your work.

Here’s how Josimar described it:
First entry in a challenge and it seemed like a real world scenario. Congratulations to EDNA team and our head of challenges @FPastor for putting this one.
Quick notes:
I’ve struggled a lot since I know nothing about this call center stuff. Had to make some research to understand the industry, the KPIs, etc. Ended up putting just some basic metrics. I think it’s good for a start. Didn’t put much effort on the visualization part (hope to get better in the next visualization summit), but used some tools from the Analyst Hub, like the color palette. It speeded up the basic coloring part.Also didn’t use many DAX, since I’ve concentrated my efforts on transformations in Power Query. The “Day Shift”, “Night Shift” column/filter was created there as an effort to see if there are any relevant differences calling during day (6 a.m. to 6 p.m.) or night (6 p.m. to 6 a.m.).
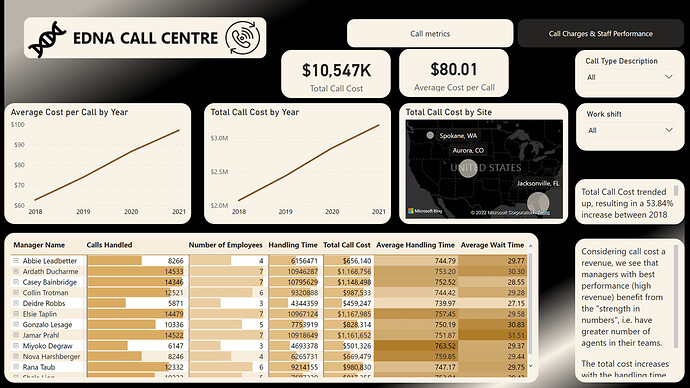
Realized that manager performance is not depending solely on handling time or number of calls handled, but it mostly depending on what I called “strength in numbers”, since the best performing manager are the ones with a larger team. So, I’d advise Mr Mark Phoney, the CEO, if he wants to increase the revenue (considering total call cost as revenue), then more human resources are needed, mainly for Spokane, WA.
Used the map here as a “natural visual filter”, and used smart narrative to get some quick insights.
It was both challenging and fun this one. This time I had enough courage to press the send button and I hope to get better in time.
All the best
Here’s the link to the report:
To learn about the real-life scenario presented for the challenge, be sure to click on the image below.

