Here’s Gustaw’s entry for Power BI Challenge 19. @Gustaw, feel free to add other details of your work.
Here’s how Gustaw described it:
Below I’ll try to highlight a few interesting features, broken down by given report page.
General info:
All pages have the similar structure and include:
a) Main navigation pane (left upper corner: summary, monitoring, HR etc.) - main sections of the report
b) Additional navigation (left pane) - refresh / back / home button
c) Main date filter (left pane)
d) Additional text / info (upper section) - info related e.g. with current selections
e) Supplemental filters (right pane)
f) KPI cards - either with YoY change or not - depending on the report page
g) Main sector / space - analysis / visualizations
h) Each page allows to use drill-through analysis (which navigates to either separate “HR performance analysis” or to “CC log”
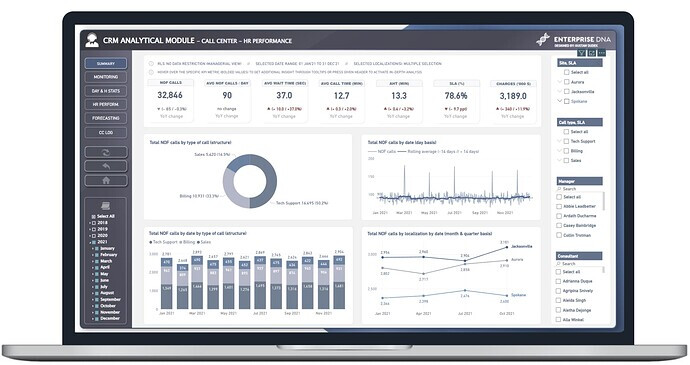
i) most of KPI cards has applied tooltips that shows both top / bottom 3 agents by given metrics (they can be activated by hovering cursor on specific KPI card)1st page: Summary
Each KPI header is a button, which enables to “drill through” to specific analysis. In other words, summary report page focuses on 7 different metrics and allows to reveal 7 different perspectives.
Each section is created in very similar way to increase report readability.2nd page: Monitoring
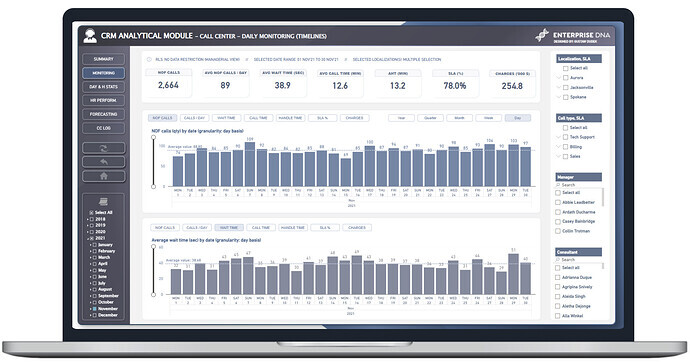
Main application of this particular report page is to analyze data in daily granularity. On the other hand however, there is a slicer which enables to dynamically change granularity to week/month/quarter/year basis with maintaining hierarchical structure of x-asis at the same time.
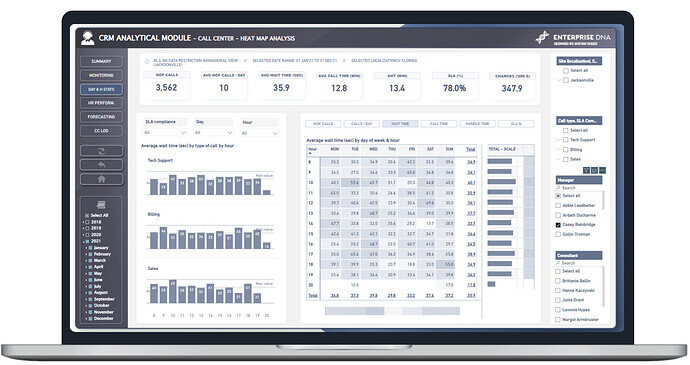
There are also switch buttons to quickly change metrics.3rd page: Day & H Stats
Main application is to analyze given metrics by hour/day. Heat map is additionaly enhanced with formatted background colour & bars.4th page: HR Perform
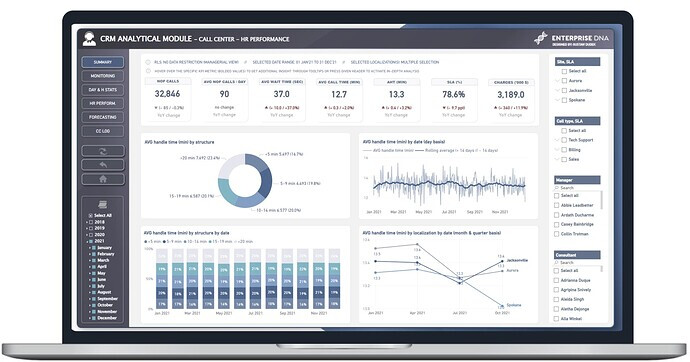
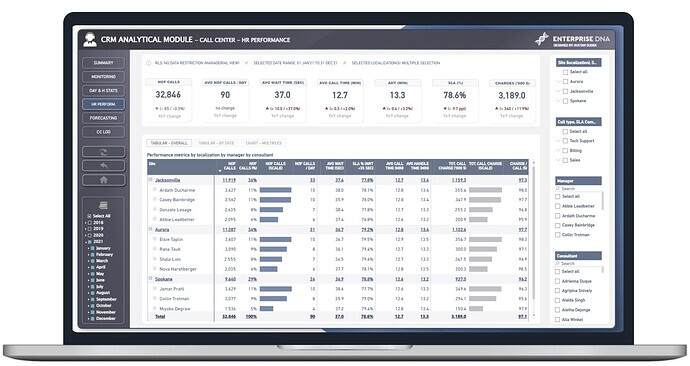
This page mainly focuses on analyzing given metrics by manager & agent (or employee).
There’re included three different views (tabular overall, tabular with data in monthly perspective, and small multiples)5th page: Forecasting
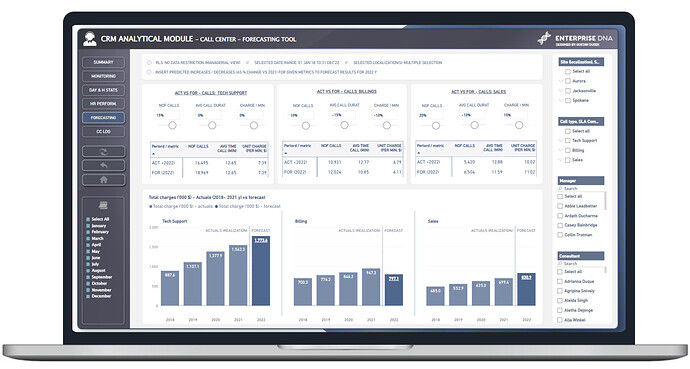
This page enables to make a simplistic forecast (of total charges $ in 2022) based upon “what if scenarios” including variability of predicted number of calls / predicted avg. duration of single call and predicted change in charge value per min. All of this is separately “linked” to different type of call, as they might vary due to different specification.6th page: CC Log
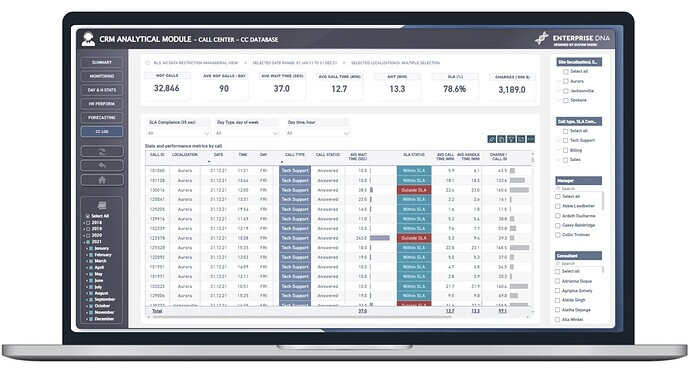
Generally it’s a form od “database” or log, which contains all of individual calls in case of need for analyzing particular records.I’ll do my best to share more details along the way.
Meanwhile, congrats for all participants. It’s cool to see such great commitment. It’s look like the number of entrants is much more impressive comparing to recent challenges. Keep up your excellent work.All best to everyone!
Here’s the link to the report:
To learn about the real-life scenario presented for the challenge, be sure to click on the image below.