Here’s Diana’s entry for Power BI Challenge 19. @DianaB, feel free to add other details of your work.
Here’s how Diana described it:
For this challenge my approach was
1 Analysis and data modeling .
- Analyze the data in Excel
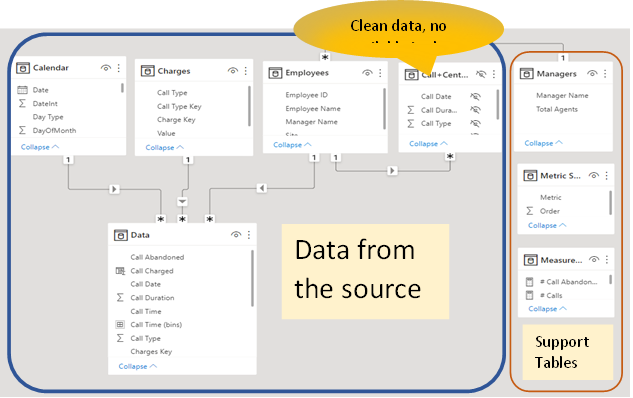
- Load the data in Power BI and follow the requirements to delete one column and add a new one.
- Because more data was delivery in later, I do some adjustment and cleaning of one file dates format and add the data all together.
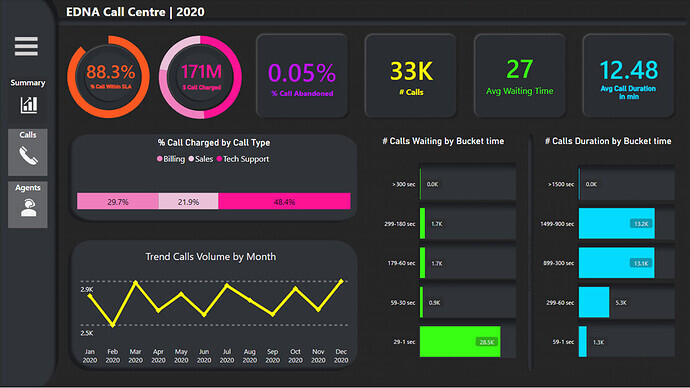
- I did not use the timetable; I create the buckets using the Group function in Power BI.
At the end, my dataset looks like:
2 Design.
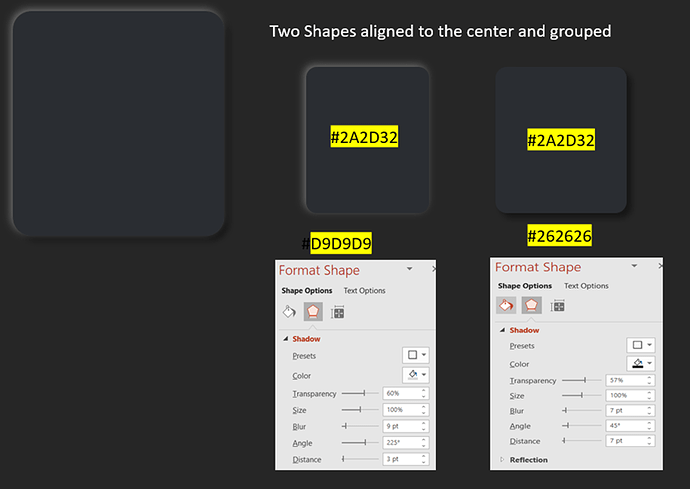
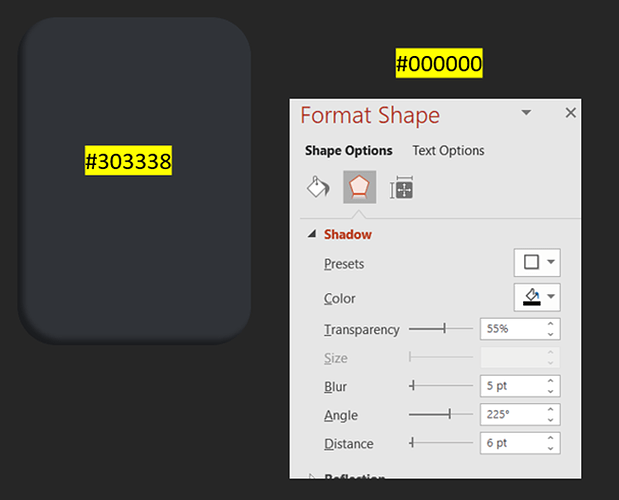
I was curious about the Neumorphism design, and I wanted to try to create a report using this technique. I created two basic images
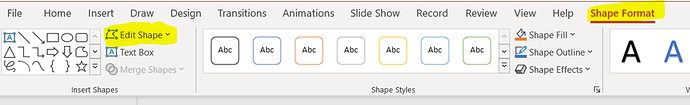
Then using PowerPoint created different shapes:
- Report Content.
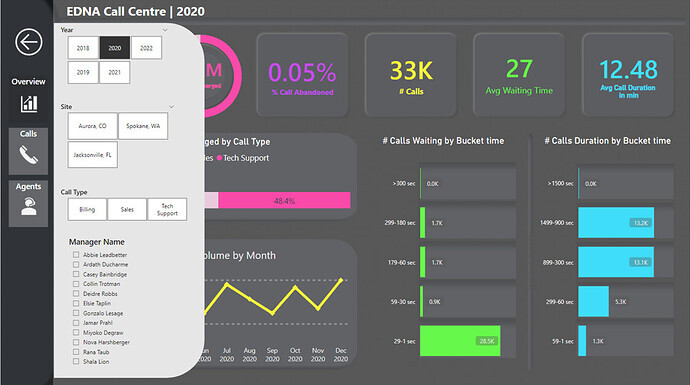
This is a very simple report it has 3 pages
Filters: Filter are available clicking the button
and closed clicking the Back button or any place in the page, not the navigation panel. This filters are synchronizer in all the pages and show the selection in the page Title.
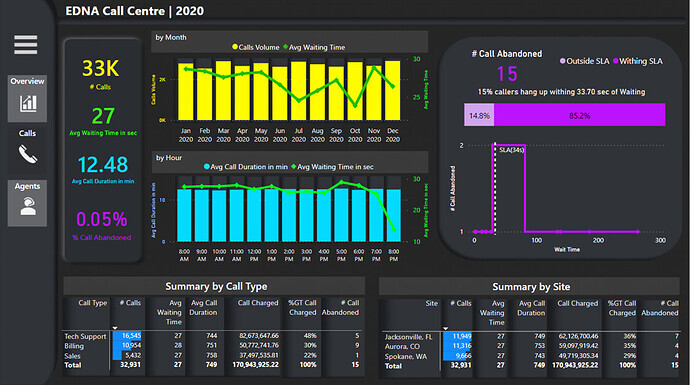
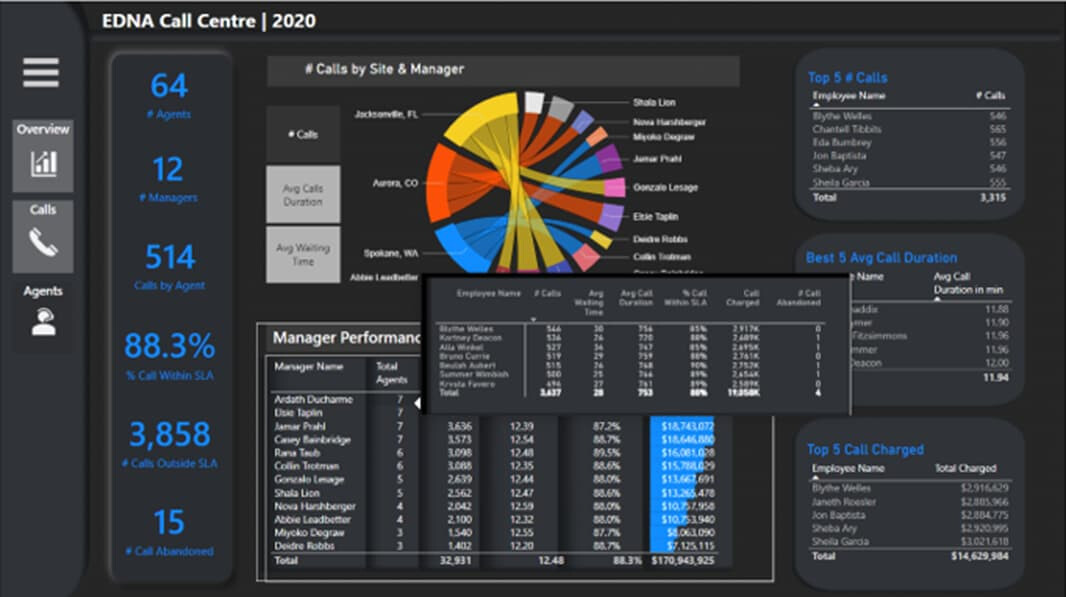
Overview, General KPIs.
Calls, Shows the rending of the calls by time Also show the status by Call Type and Site
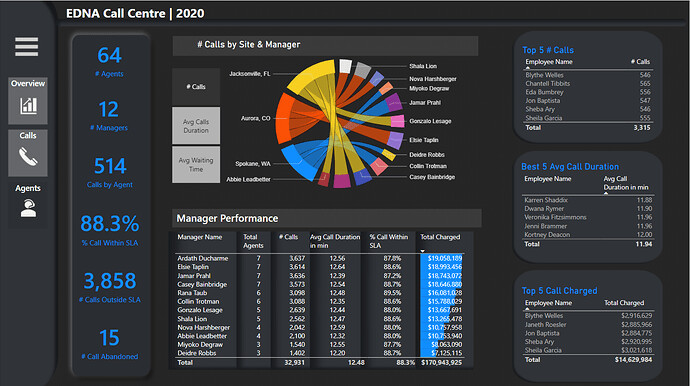
Agents, Show the detail of the calls by Manager and Agent. Top 5 agents by different metrics and the Managers performance. This page has a tool tip view of the data by Agent in the Managers performance table.
Published to Novypro: https://www.novypro.com/project/edna-challenge-19
Thanks
Diana B.

To learn about the real-life scenario presented for the challenge, be sure to click on the image below.
