All,
My main objectives in this report were:
- Making the analysis as actionable as possible, centering on specific actions that I thought followed directly from the analysis findings, and including those findings and recommended actions right up front in the report.
- Integrating Power BI and R to perform a full statistical analysis to determine which factors likely did and did not have an impact on cost. Because of my focus on making the recommendations actionable, I thought cost was a logical centerpiece for the report.
- Continuing to learn how to use some new tools from our recent technology partners – Zebra BI and Numerro.
These are my notes from the different stages of my development of the Data Challenge 19 submission. This sequence is the typical one I use for developing any substantial report.
I. Data Exploration
Before I do anything with regard to developing a report, I just import the raw data and do some exploratory analysis. This gives me a good general overview of the size and shape of the data, and the characteristics of the individual fields.
George Mount did an excellent video on Exploratory Data Analysis (EDA) Using Excel at the February 2022 Enterprise Analytics Summit (this video is available on the portal).
For those of you who are R users, there is a package called dlookr that will perform an extremely detailed exploratory data analysis with just a few simple commands. This is what I used for this report.
I recommend doing EDA in either Excel, R or Python since they all have canned functions and routines for performing this task. In Power BI you need to build the whole EDA from scratch.
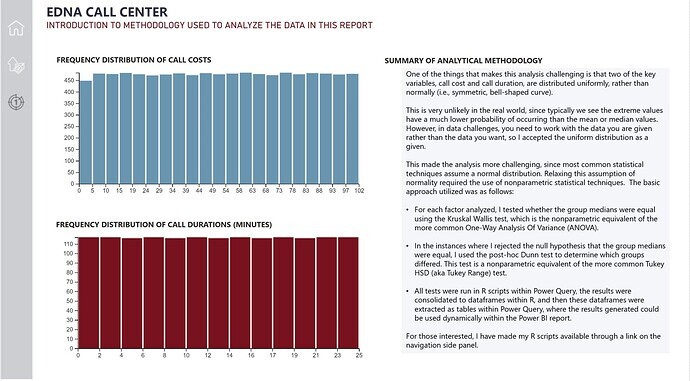
As part of the exploratory data analysis I learned that neither Call Costs nor Call Duration were distributed normally. This was an extremely important finding because it indicated that standard parametric statistics, such as t-tests, ANOVA (analysis of variance) and other commonly used techniques that assume normality would not be valid for this report. I address this issue at length in the Analysis Planning and Data Analysis sections.
II. Analysis Planning
This is one of the most important steps for designing a clear, cohesive and actionable Power BI report. The analysis plan focuses on the following components:
- What question(s) are you going to build your analysis around?
- What additional data are you going to need to perform that analys
- What analytical techniques are you going to use?
- If these are statistical techniques:
o What are your null and alternative hypotheses?
o What level of alpha are you going to use to determine significance?
o What statistical tests are you going to apply?
o How are you going to perform those tests?
How are you going to visualize the results of the analyses?
For this report, the three primary questions I focused on were:
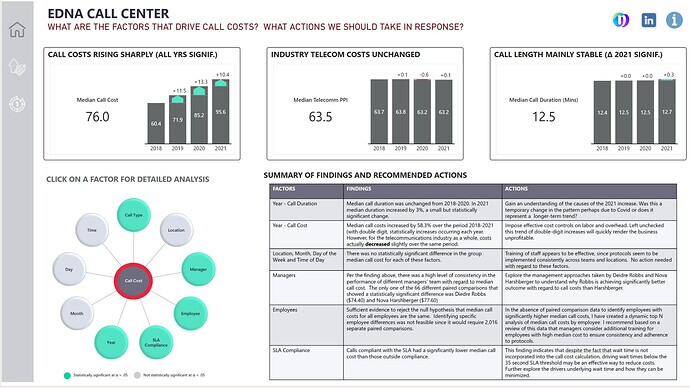
• What are the factors that drive call cost?
• What actions should be taken in response to that information?
• How do the patterns we are observing regarding call costs compared to the patterns in the broader industry
In terms of the specific factors to look at, these were the main ones I had planned to test regarding their influence on call cost.
Given that the key variables were not distributed normally, this meant that all the statistical analysis would have to be done using nonparametric methods (an area of statistics that makes no assumption about the initial distribution). This decision necessitated the use of R, since is not possible to do the necessary nonparametric statistical analyses in Power BI alone.
The two primary tests identified for the analysis were the Kruskal-Wallis test, the nonparametric equivalent of Analysis Of Variance (ANOVA) and the post hoc Dunn’s test (the non-parametric equivalent of the Tukey Range Test). This will be discussed more in the section on Data Analysis.
III. Data Prep and Data Modeling
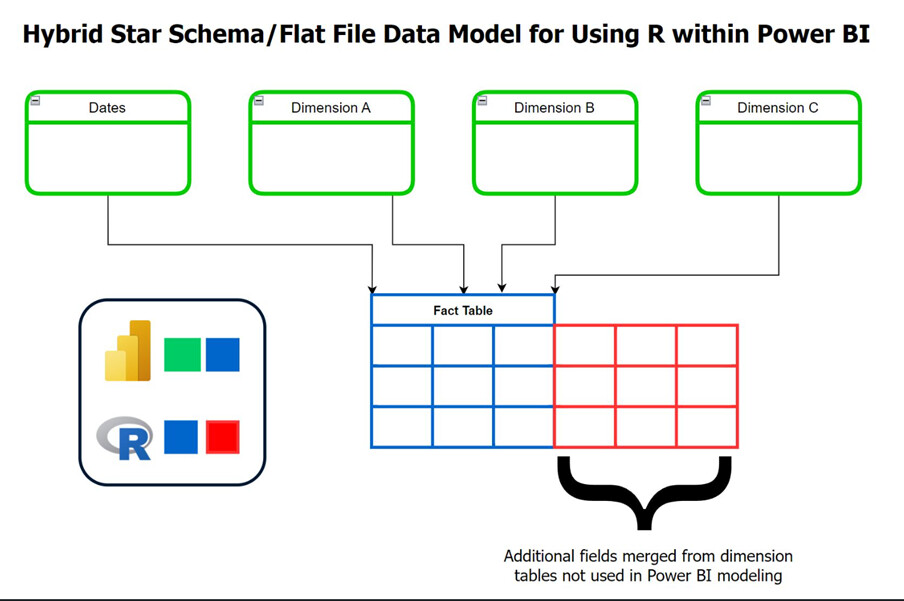
Knowing that my analysis was going to need to integrate R and Power BI presented some challenges here since Power BI is highly optimized for star schema data models, while R is easiest when using a flat file.
To resolve this conflict I have been using a cool hybrid structure for analyses integrating R within Power BI that I wanted to share. What I do is first figure out exactly which additional fields from my dimension table(s) I’m going to need for my analysis, and then merge those into my fact table(s) using Power Query. The result is the expanded fact table depicted below, where the blue represents the original fact table structure and the red the added columns merged from the dimension table that will be needed in the R analysis.
Uploading: image.png…
This results in some redundancy and some increased file size, although I find those downsides a good trade for the ease of use, flexibility and transparency this approach affords.
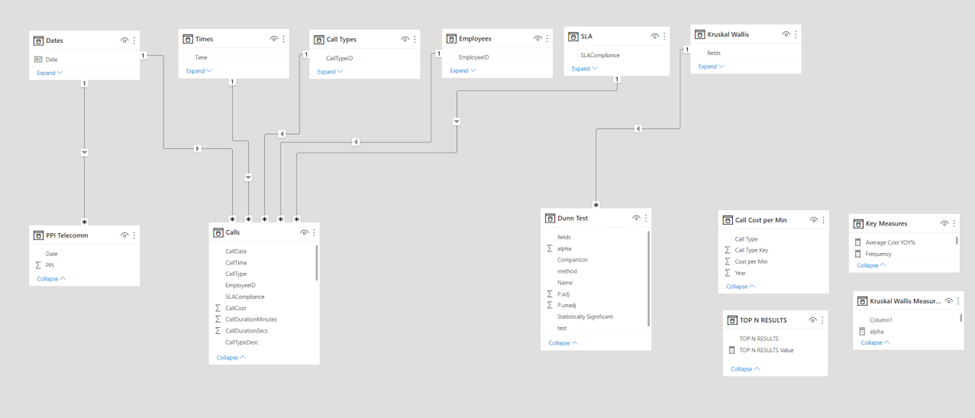
Using this principle, here is my final data model:
The Calls table is my primary fact table, and I’ve added a secondary fact table pulling cost information from the St. Louis Federal Reserve Bank’s online FRED DBMS in order to answer the question from my analysis plan about whether the patterns observed in the analysis of the call center costs are consistent with the same pattern in the broader telecommunications industry over the same time period.
Finally, I had an additional two table structure composed of the results of the Kruskal-Wallis nonparametric test which filtered the results of the post-hoc Dunn’s test. This is because whether the Dunn’s test was relevant to run or not was contingent on the results of the K=W test. (If the K-W test showed no reason to reject the null hypothesis that the group medians were equal, there was no reason to run the Dunn’s test).
The key takeaway from all of this is that the initial exploratory data analysis informs the analysis planning, which in turn has major implications for the structure and composition of the data model. If you jump directly into data prep and data modeling without doing the first two steps, you may end up with a data model that does not support the key questions you want to answer.
In the data modeling phase, I also made extensive use of the suite of Enterprise DNA Power Tools developed by MS MVP Greg Deckler:
I used Power Sort Pro to automatically set all the sort fields correctly for the Enterprise DNA Extended Data Table and then I used Metadata Mechanic Pro to set all of my field aggregations to none, my dates to short date format and my cost fields to currently 2 decimal places. All of this took about 60 seconds, and involved no manual adjustments – a huge time saver.
IV. Data Analysis
In analyzing which factors likely did and did not affect call cost and duration in a statistically significant way, I employed the following methodology:
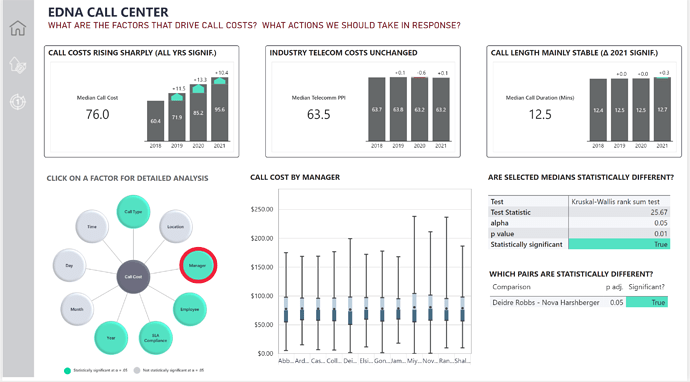
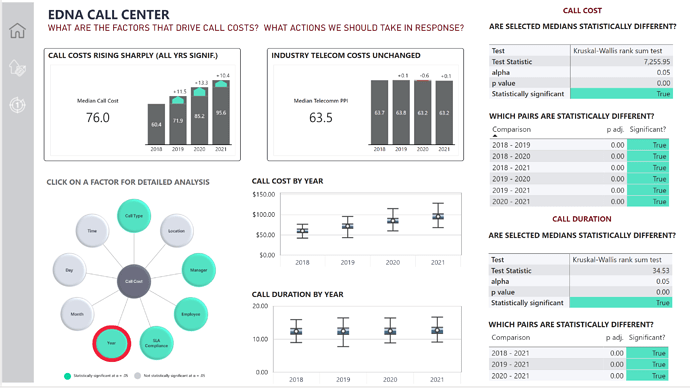
• For each factor analyzed, I tested whether the group medians were equal using the Kruskal Wallis test, which is the nonparametric equivalent of the more common One-Way Analysis of Variance (ANOVA).
• In the instances where I rejected the null hypothesis that the group medians were equal, I used the post-hoc Dunn test to determine which groups differed. This test is a nonparametric equivalent of the more common Tukey HSD (aka Tukey Range) test.
• All tests were run in R scripts within Power Query, the results were consolidated to dataframes within R, and then these dataframes were extracted as tables within Power Query, where the results generated could be used dynamically within the Power BI report.
The third bullet turned out to be quite difficult to implement since statistical results in R come out in somewhat free-form text format. For common statistical tests, these results can be swept up into compliant dataframes (a dataframe is the R equivalent of a Power Query Table, and only results in dataframes get pulled back into Power Query when R is invoked from within PQ) using an R package called Broom. In this case, the K-W test results were able to be swept into separate dataframes which were then appended into a single dataframe within R and then transformed into a PQ table.
The Dunn’s Test results were the real problem child, since Broom could not handle the Dunn’s Test results. Thus, I had to write custom R code to assemble the results into a compliant dataframe that could then be transformed by PQ into a separate results table within the data model.
For those interested, I have attached my R scripts for what I referred to as “extracting the hostages” (capturing the statistical results trapped in R and safely bringing them into PQ in an automated way).
In addition, for all of my DAX, I used DAX Editor Pro (another tool in the Power Tools Suite) which saved me a lot of time in terms of being able to quickly create DAX measures from other measures using the “Copy” button in the app. This technique is illustrated in my YT video walking through the features of DAX Editor Pro.
In general, my DAX for this report was quite simple – nothing more complicated than a YOY % calculation.
Data Visualization
This has always been my weakest of the main pillars within PBI, despite my focused efforts to improve my skills in this area over the past year. Because of all the time spend doing analysis planning, EDA, data modeling and data analysis, I didn’t actually have much time left to spend on the report itself.
Thus, to speed things up, I used the Numerro template and color theme. I also used the Zebra BI Cards visual for the KPIs, which I love because they provide detailed context to the KPI numbers and also have the ability to drill though on the cards themselves (though I didn’t use the drill through capability in this report – maybe next time…).
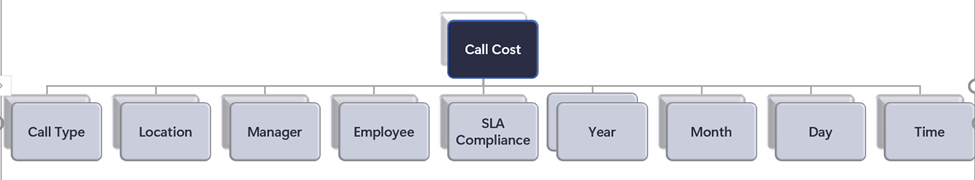
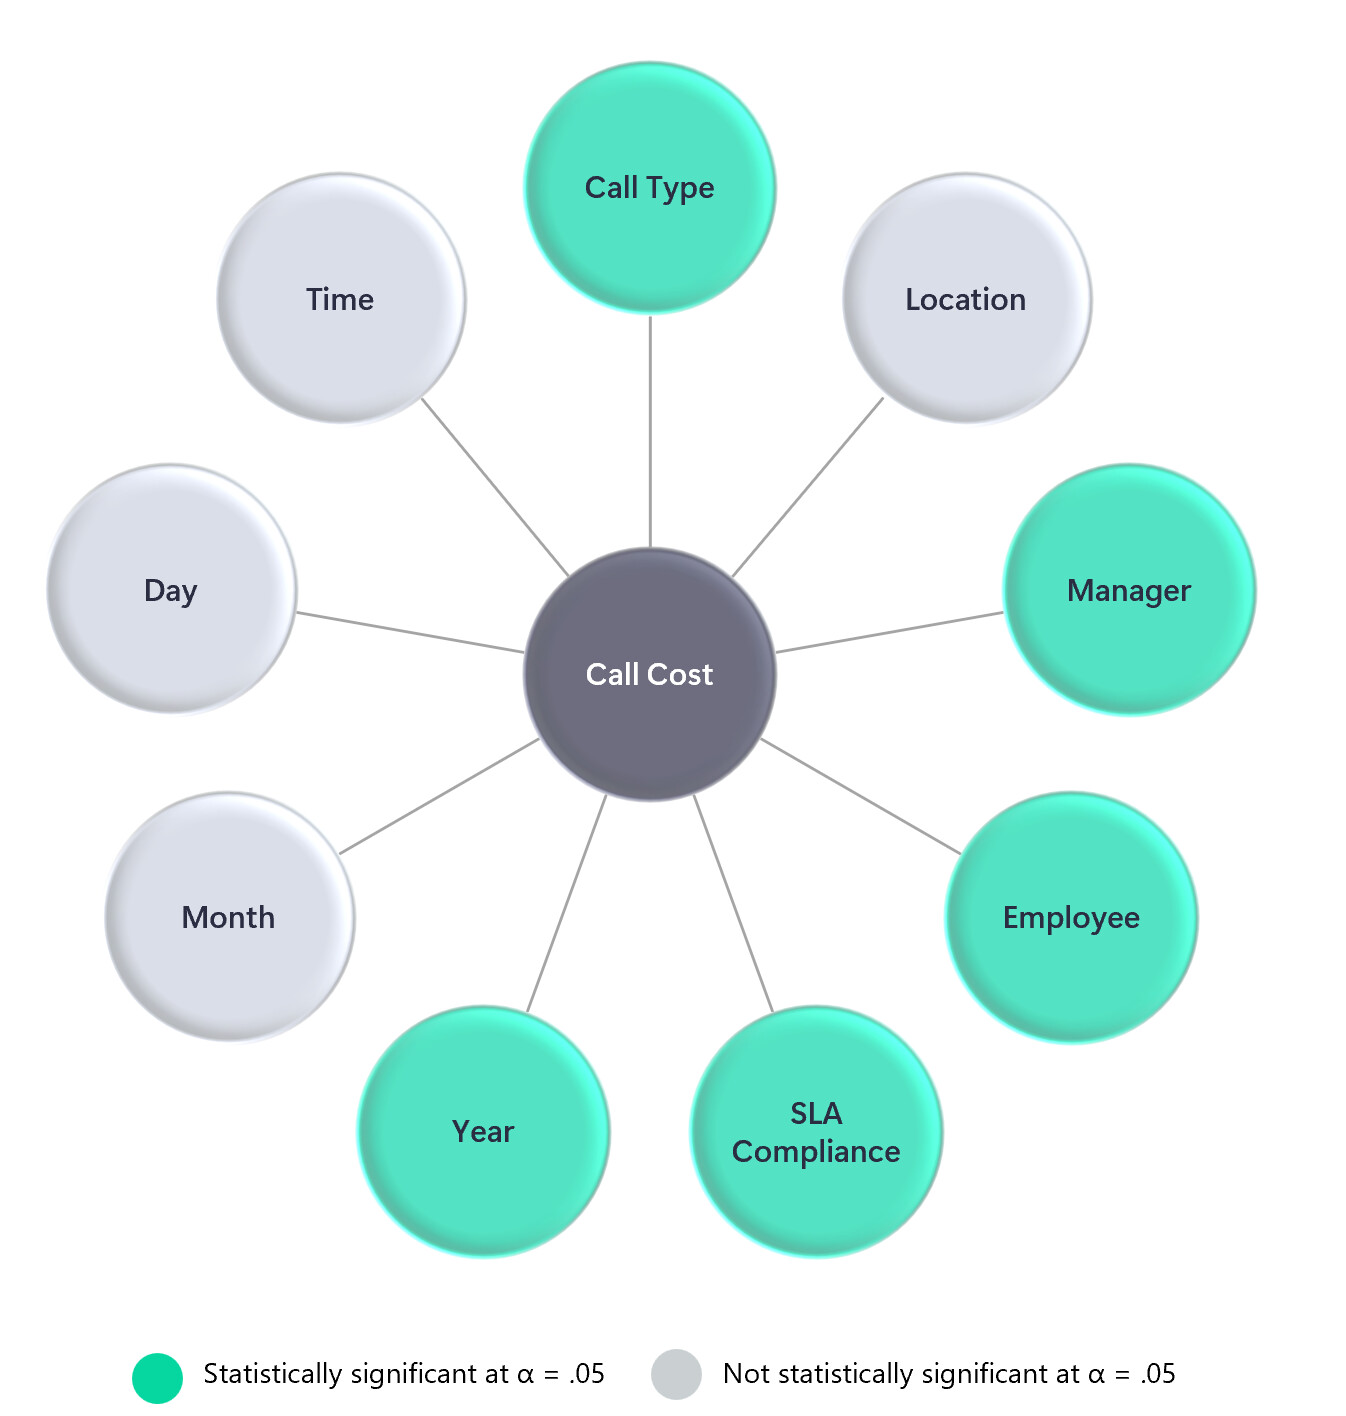
The centerpiece of my visual design was a custom Radial Chart I built in PowerPoint to depict all the potential factors that might affect Call Costs, and indicated those that were statistically significant using the bright green color. I then overlaid circular, transparent buttons over each circle on the radial chart and set the default, hover and press state to show no border default, a red border on hover and the same red border on click. Each button was tied to a page navigation action, whereby the report would show the details of the statistical analyses for each individual factor tests.
While I think this structure worked well in the final version of the report, it was incredibly labor intensive – requiring the management of 10 buttons across 10 pages across 3 button state – a total of 300 separate button states for one chart!!! Not something I would eagerly do again.
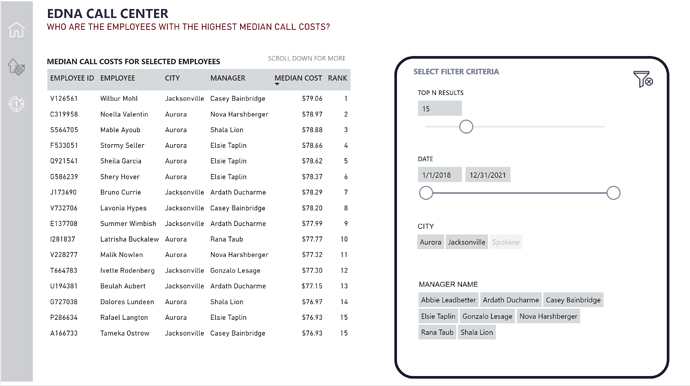
I also included a couple of additional background pages (methodology and “about this report”), plus one additional analytical page analyzing employees with the highest median costs based on user filtering of the relevant subset of the data.
VI. Conclusions
What worked well?
- Overall, I learned a tremendous amount in developing this report, and so in my book that automatically makes it a big success.
- I generally think the analysis here was quite good, and extracted some unique and highly actionable findings.
- The Power BI/R integration worked well once I figured out how to “extract the hostages”.
What could be improved?
- Compared to many of the other entries, I think the visualization/style of this report was somewhat blocky and primitive – did not make maximal use of the Numerro template
- I did not carefully think through the choices regarding the navigational structure, leading to unnecessary complexity
- I think the findings and actions could have been presented in a more creative and attractive way that would’ve garnered more attention
Congratulations if you made your way through all of this. I hope you found it useful. I really enjoyed this challenge and learned an enormous amount from the experience which I wanted to document in detail here for my own purposes as well.
Thanks to Federico and his team for running an awesome challenge! See you in the next one…
DC 19 R script - KW.R (2.0 KB)
DC 19 R script - DunnTest.R (1.7 KB)