Here’s Steven’s entry for Power BI Challenge 17.
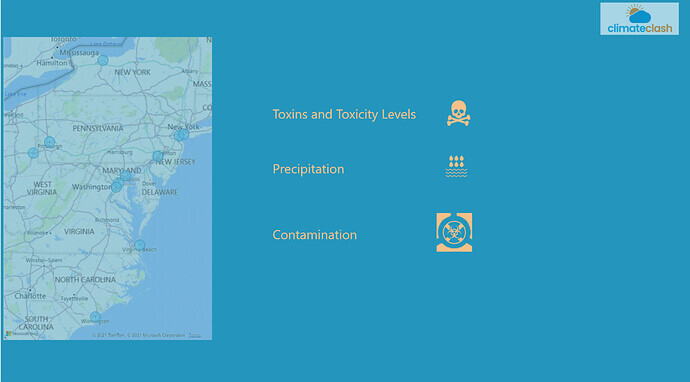
To learn about the real-life scenario presented for the challenge, be sure to click on the image below.
Here’s Steven’s entry for Power BI Challenge 17.
To learn about the real-life scenario presented for the challenge, be sure to click on the image below.
This post is part of the Enterprise DNA platform improvements. Through these posts, members and non-members can showcase the resources and inspirations on how they come up with their challenge submissions. We hope all members can utilize it efficiently.
nice work on this Steven. really like how you’ve used icons and a different color theme. certainly is unique but works really well because you’ve stayed consistent with your colors throughout and it really matches the logo you’re decided to use for your company name as well.
even the icons match out which I think is really neat.
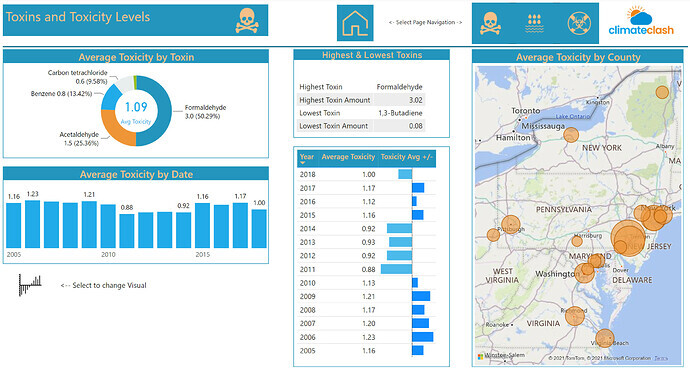
also like how you’ve used bookmarks particularly with being able to change a visual dynamically. I really love this technique and brings so much more insight to a page without having to use up a ton of real estate
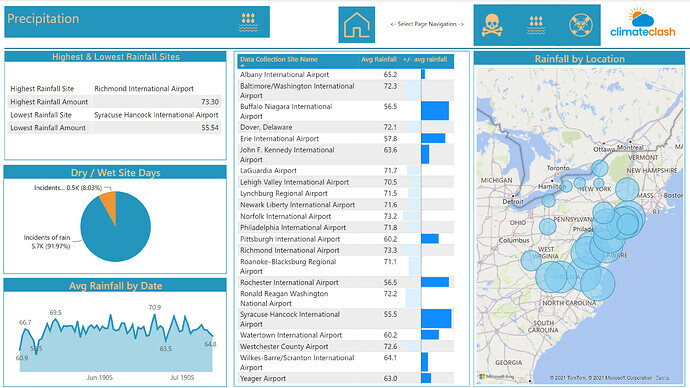
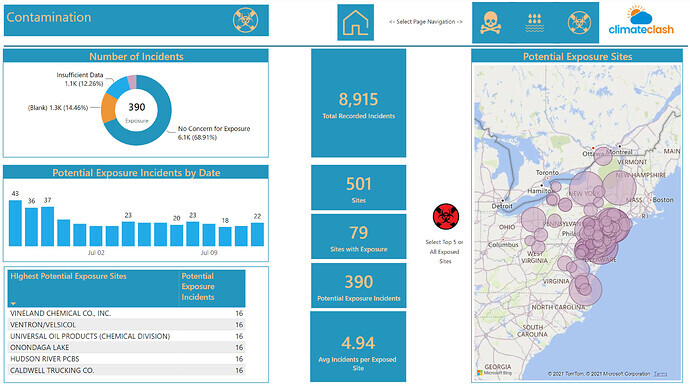
one thing that I really find great about this report is that there’s a ton of information and ways for a consumer to drill down into specific insights but it doesn’t feel overwhelming at all. a lot of that has to do with the grid formatting and pattern that you’ve used to layout all of your visualizations and insights.
some really nice small touches throughout this report so really appreciate the effort that has gone into it
Well done.