Here’s Paul’s entry for Power BI Challenge 17. @Paul.Gerber, feel free to add other details of your work.
Here’s how Paul described it:
Hello eDNA community. I am a first time Power BI challenger but a Power BI user for almost one year. @Brian asked me to start doing these challenges so this is my first go.
When I first looked at the data and what the indicators were coupled with my target audience, my first thought was to find correlations in between the datasets. As an engineer, this is just out of habit. I think I was making this harder than what I needed it be.
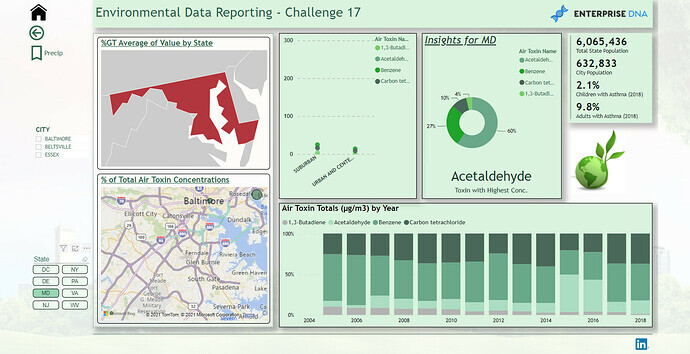
My approach at first was to see what toxins were related to number of asthma cases. Asthma in adults were higher than in children. But formaldehyde was a top toxin that was present in the majority of the states.
I tried to do a very simplistic approach. But doing this challenge I found that overall throughout the Mid-Atlantic states, children with asthma is slightly more than asthma in adults.
Also what was interesting, in all states over the course of years, formaldehyde was the highest contributor of air toxins.
What it Causes
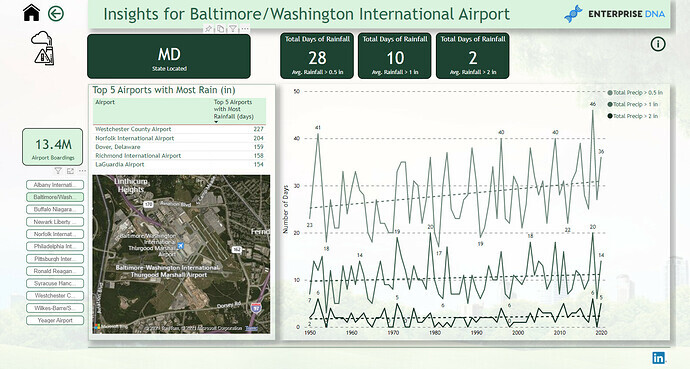
Formaldehyde exposure is ubiquitous and occurs in homes, communities, and workplaces. Formaldehyde is a high-volume production chemical with numerous industrial and commercial uses as a solution, disinfectant, preservative or to produce industrial resins used to manufacture adhesives and binders in wood, paper, and other products. It is present in many household products, such as foam insulation, cleaning and personal care products, pressed wood products such as particleboard and plywood, and as a result is a common indoor air pollutant found in virtually all homes and buildings [1–9]. Homes are impacted by off-gassing of formaldehyde from new housing materials, with availability and rates of ventilation having minimal impact on exposure levels [10].Rainfall totals were interesting. Westchester Airport had the highest amount of days out of year for rainfall. Rain and humidity can attribute to mold and mildew; problematic for asthma people. Westchester is NE of NYC. So my assumption would be that NYC would get a great deal of rain as well.
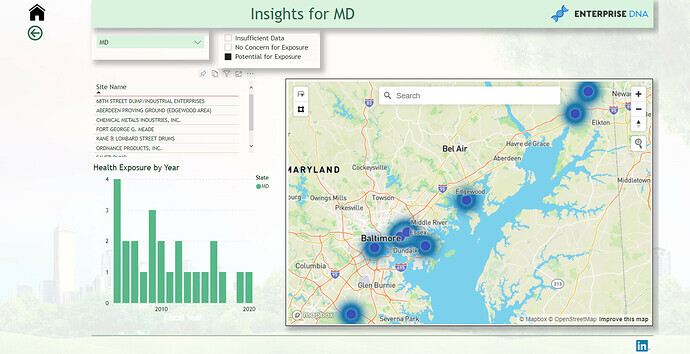
I treated human exposure with just a map with “heat map” selected in the visual. Then using a slicer to show which sites had the “potential for exposure”.
Throughout the report I used the basic DAX measures then expanded on those measures. I used TREATAS quite a bit to “bang” two data tables together virtually which helped a lot. I also used Dynamic Text Measures too for my graphs and titles. I feel it helps the user to know what value they selected to view in the Dashboard and to label the graphs.
Thank you for taking the time to read and to view my dashboard. I appreciate all feedback and thoughts.
Paul
To learn about the real-life scenario presented for the challenge, be sure to click on the image below.
