Here’s Kim’s entry for Power BI Challenge 17. @KimC, feel free to add other details of your work.
Here’s how Kim described it:
Here is my submission for Challenge 17
Initially I wasn’t going to participate but due to some encouragement (Brian & Federico) I began and then I wanted to give up many times but again due to some encouragement (Brian & Federico) I persevered, and I am very happy I did.
What was difficult:
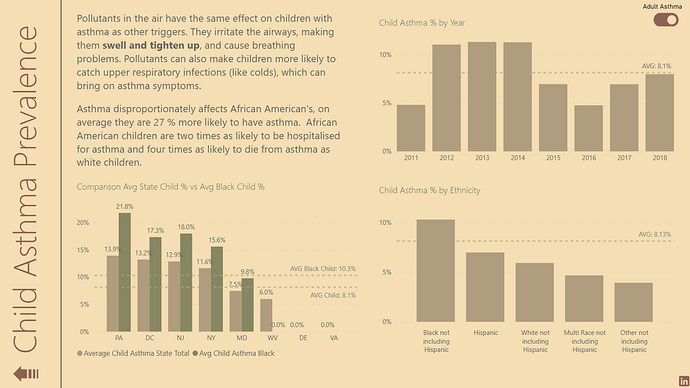
The data as I couldn’t find the story and it took some time to work it out. Best advice I received was to focus on the long-term trends.
Managing my time…once again I spent way too much time on this report.
What was easy:
Data was clean and easy to work with.
Dax was easy, only a couple of tricky ones.
What worked:
I did my first Python chart!!
What didn’t work:
My Python chart whilst it worked in the desktop version, once I published the report, I got an error message which I didn’t have time to resolve. Instead, I inserted an image of the chart.
Dumbbell chart – when I published the report, it come up that I need a licence in red. Instead, I inserted an image of the graph as I had no time to redo it.
Techniques learnt from Accelerator that I could apply to this challenge :
Conditional formatting map circle colours using dax
Conditional formatting colour of max value in chart using dax
Bookmarks – best tip ever was to group charts/images/tables etc together, makes bookmarks so much easier to work with
Hiding slicers with bookmarks
Horizontal bar chart – love this one
Help received:
County table with Latitude/Longitude coordinates from Brian
To learn about the real-life scenario presented for the challenge, be sure to click on the image below.
wow Kim this is seriously fantastic. I love any creative aspects to your report and your analysis.
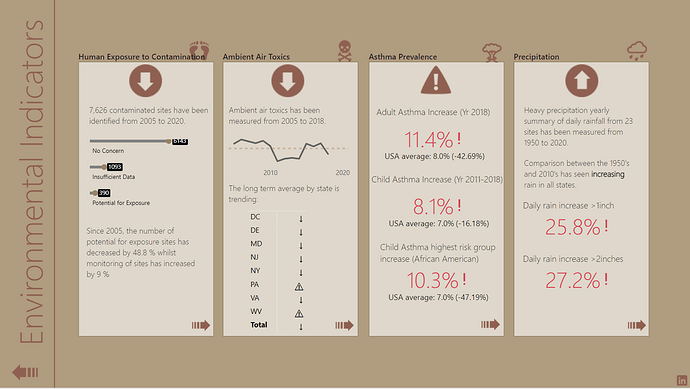
love the icons and the way that you have created some key indicators on your environmental first page.
I think the way you’ve extracted the key insights and created a summary page is quite unique but seriously effective and very helpful to the consumer and user of this report.
also just generally like the design and way you’re used simple visualizations in a lot of cases but information is highlighted in a compelling way.
also the titles and navigation experience are also top quality. the text in each page also adds a lot of insight to the general analysis that’s a consumer would want to see.
really impressed and loving seeing your enhancements at each different challenge submission.
This is a fantastic report – I think your best challenge entry yet. It is a wonderfully clean, attractive design and I love the structure of the summary page. There’s a tremendous amount you can tell from this page just at a very quick glance, and the navigation to the detail pages is very intuitive and smartly designed.
On the detail pages, I think your use of toggled bookmarks allows a lot of information to be conveyed without crowding the page. I also very much like the inclusion of prominent text conclusions, making the viewer aware of the conclusions you’ve drawn from the data rather than leaving them to figure it out on their own.
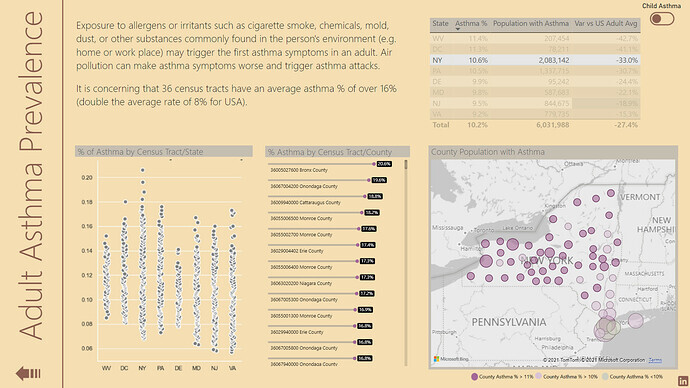
Very impressed by the way you’ve challenged yourself, for example by incorporating the Python version of the dot plot with jitter, which was a great way to depict that information.
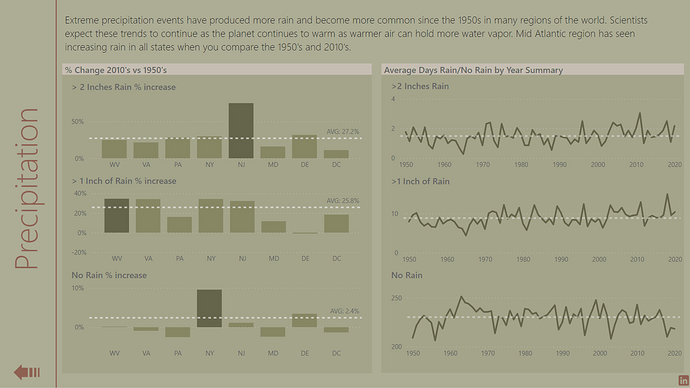
Also, great choices on the custom visuals – I thought the horizontal bar chart and dumbbell chart were used to great effect throughout the report. So many nice small touches in this report that just add a level of polish and professionalism to it (the popout slicers, the web link to the LinkedIn page, the clever use of icons, etc.)
Finally, really appreciate how you tied your learnings in the Accelerator program to your report development.
The only suggestion I would have on this report would be to hide all but the main page, which would require the viewer to navigate through the report as you intended.
Overall, just a tremendous submission and a great example of how quickly someone can advance to an expert level through focused study and regular participation in these challenges.
Can’t wait to see how your style and technique evolve in future challenges.

whilst it worked in the desktop version, once I published the report, I got an error message which I didn’t have time to resolve. Instead, I inserted an image of the chart.