Here’s Jarrett’s entry for Power BI Challenge 17. @JarrettM, feel free to add other details of your work.
Here’s how Jarrett described it:
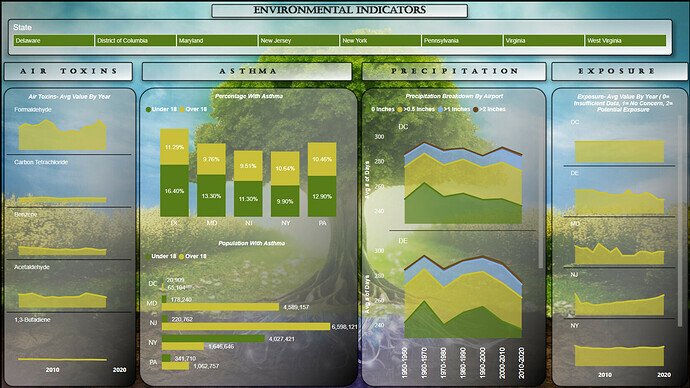
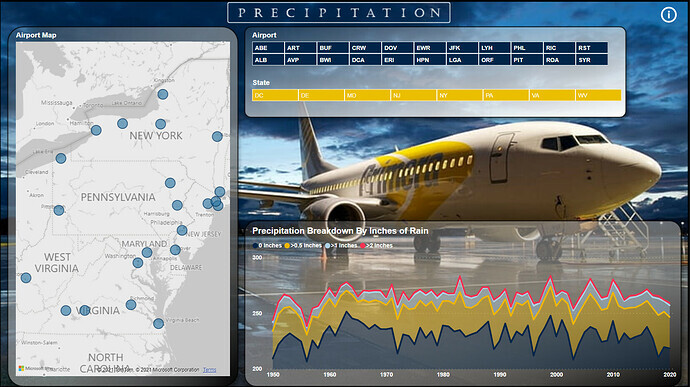
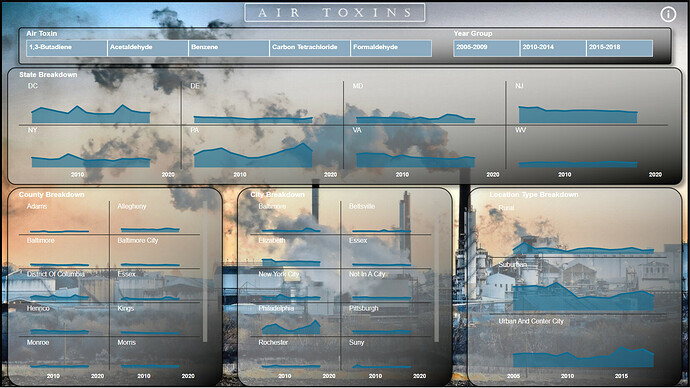
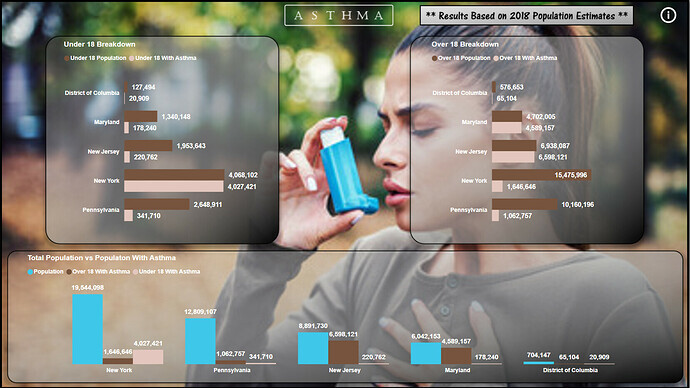
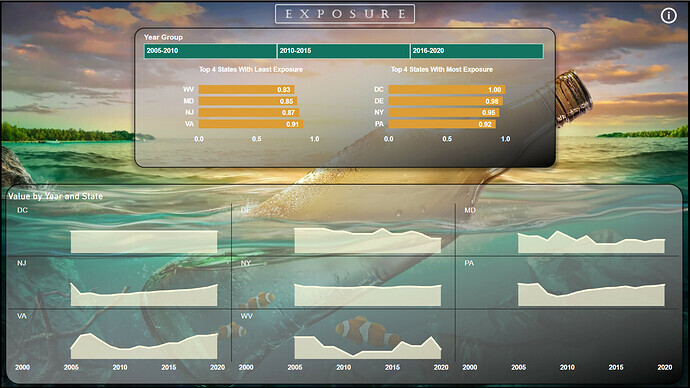
Here is my entry for Challenge 17. Hope to a have a full writeup sometime over the weekend. Nothing too crazy with this entry, but tried to create colorful appealing themes for each of the pages of my report. Instead of having one overall color theme, each page had its own theme based on the background picture. Almost all of the design work was done in PowerPoint. Looking forward to seeing all of the upcoming entries.
To learn about the real-life scenario presented for the challenge, be sure to click on the image below.

This post is part of the Enterprise DNA platform improvements. Through these posts, members and non-members can showcase the resources and inspirations on how they come up with their challenge submissions. We hope all members can utilize it efficiently.
Really nice design on this one share it and love all the backgrounds and how you’ve worked those into the overall reports visualizations.
I really love the small multiple visuals as well that you’ve used. I think these are actually really compelling for a range of insights in it’s a technique and feature that I haven’t realized was available to us until very recently. thank you showcased the use of those really effectively particularly in your air toxins page.
I think what really stands out to me in this one is how a nice background can really add a lot of context to a consumer around what they are looking at. It even prevents you from having to actually create massive titles or good labeling. If you have the right background image it can produce something in the brain which turns on the mind to that specific subject. really interesting and I feel like you’ve done it so neatly in your submission.
Like it. Nice one!
1 Like