Here’s the entry from one of our non-member participants, Gliceria.
Here’s how Gliceria described it:
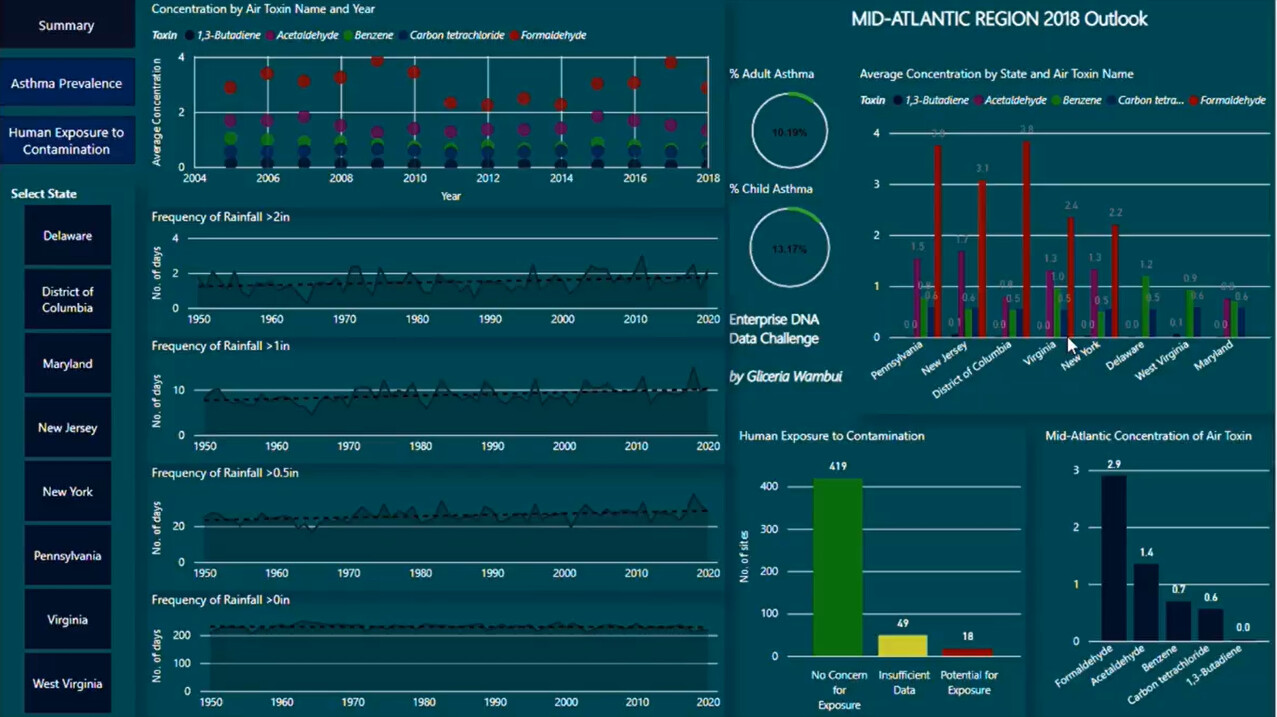
I accepted the Enterprise DNA Ltd challenge for the first time. I enjoyed working on the environmental data with the aim of showing the growth patterns in key indicators: heavy precipitation, ambient air toxins, asthma prevalence and human exposure to contamination in the Mid-Atlantic region.
To learn about the real-life scenario presented for the challenge, be sure to click on the image below.

This post is part of the Enterprise DNA platform improvements. Through these posts, members and non-members can showcase the resources and inspirations on how they come up with their challenge submissions. We hope all members can utilize it efficiently.
nice submission here to the challenge and I really like some of the insights you’re put together here. Particularly I like the way that you have created the air toxin visualization. I think this is a unique take on viewing those insights overtime and definitely a superior way to visualize it then then how I chose to do it.
one thing definitely that sticks out is the colors. Some of the colors within the charts are very different to the background and I don’t really like the contrast so much. There’s a very simple fix around theming and that’s all I think you need to adjust here to get consistency.
I think also maybe some of this could have been broken out into different pages. Or maybe using bookmarks you could have selectively brought in different insights into view rather than having everything in one page. Anyway sometimes it’s hard to convince and summarize everything in one page and I think you’ve done a pretty good job overall.
well done on getting involved and look forward to seeing more in the future