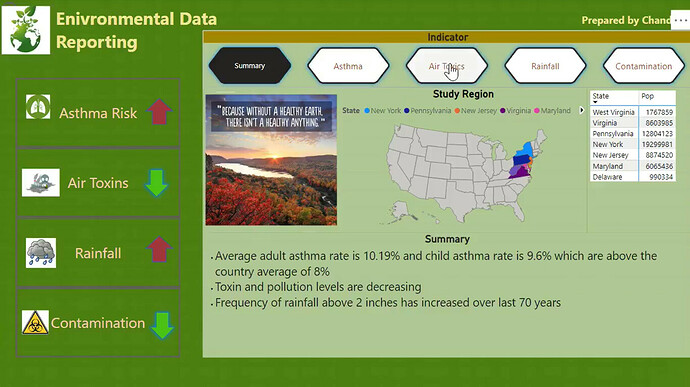
Here’s the entry from one of our non-member participants, Chandra.
Here’s how Chandra described it:
Power BI Challenge 17 – Environmental Data Reporting
Enterprise DNA Ltd, I accepted the #EnterpriseDNAPowerBIChallenge.
Thankyou for giving the great opportunity to work with environmental data.
Any feedback would be greatly appreciated. Thankyou.
Data: United States Mid-Atlantic Region Environmental Data
Tools Used: Power BI
To learn about the real-life scenario presented for the challenge, be sure to click on the image below.

This post is part of the Enterprise DNA platform improvements. Through these posts, members and non-members can showcase the resources and inspirations on how they come up with their challenge submissions. We hope all members can utilize it efficiently.
hey nice submission and really like how you have being quite creative with your navigation icons up the top. looks to me like you’ve used nice bookmarks or maybe just navigations to different pages. I like it it’s a nice work.
definitely the colors you’ve used within the map really stand out to me as something that could be easily improved. you want to make sure you’re getting a consistent theme across all of your colors including the backgrounds, icons, visualizations etc. it’s maybe just a tiny bit of Polish that is lacking and very easily fixed. you’ve obviously got the analytical thought process down but also you wanna make sure you are presenting reports in a compelling way.
really like the summary text as well to bring more context to what the analysis actually is. it is a nice touch.
Thanks for getting involved.

