Congratulations on passing the DA-100 exam!
1 Like
Congratulations on the DA-100 certification!
3 Likes
Thank you @BrianJ 
I wish I could spend more time on both the analytical and visualization parts. Hopefully, for the next challenge, I will have more time and will try to do my best.
2 Likes
So what is next ?
When is this Challenge end ?
What is happening ?
@ericet ,
We got it covered. @sam.mckay is working on his reviews of the entries. @haroonali1000 is working on the judging and the wrap up for later this week. We will also be doing some YouTube videos related to the Challenge, and rolling out Challenge #17 later this month.
- Brian
2 Likes
Wow Brian, what a spectacular report. Zebra BI to the max!
3 Likes
Thanks, @sam.mckay! Had a lot of fun learning those, and will be putting some video content together soon focused on how to use both Zebra BI visuals.
- Brian
2 Likes
Congratulations  and welcome in the DA-100 Club
2 Likes
Hello, I am going to make a late attempt on this challenge. I have 2 Questions.
First , there is a column # in the dataset , What is that for , I had earlier thought that was index number but it does not seem to be one since its not in sync with start date.
Second , am I correct in assuming that this data is representing time sheet for a Single Employee?
jps
numbers-export-atwork.csv (51.9 KB)
Here is the correct file.
Yes, it’s a single consultant with multiple clients and multiple hourly rate and also multiple regular day from 7 to 8 hours per day. That’s the last column hours per day to calculate the utilization % rate.
Have fun
Eric
1 Like
See my reply
Thank you for that.
What is the first column?

I would have assumed this to be index but doesn’t match the sequence of dates
“# has no importance
The important columns are:
Duration, Hourly Rate, $, Bonus, Earnings $, Client, Project, Task, Hours per Day
Eric
1 Like
Got you. ![]() Thanks
Thanks
The data structure is based on a iOS app called atWork
That’s what I use to keep track of my time doing consulting at my customers. I added one column to the data, hours per day for my utilization ratio. (Which I think has a great added value) to the data visualization.
2 Likes
Here’s the entry from one of our non-member participants, Prem.
Here’s how Prem described it:
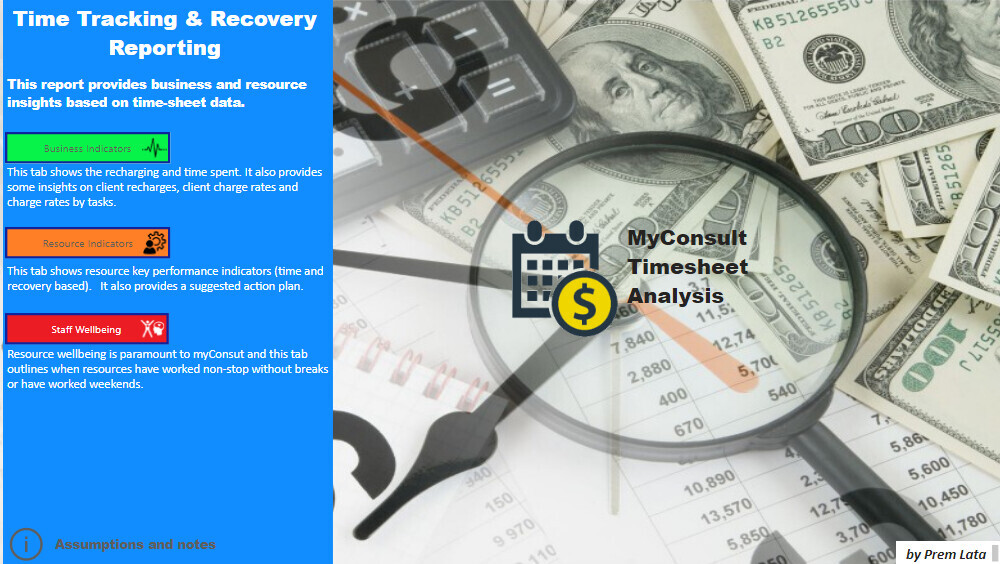
I am a complete beginner at PowerBI and this is my first challenger submission.
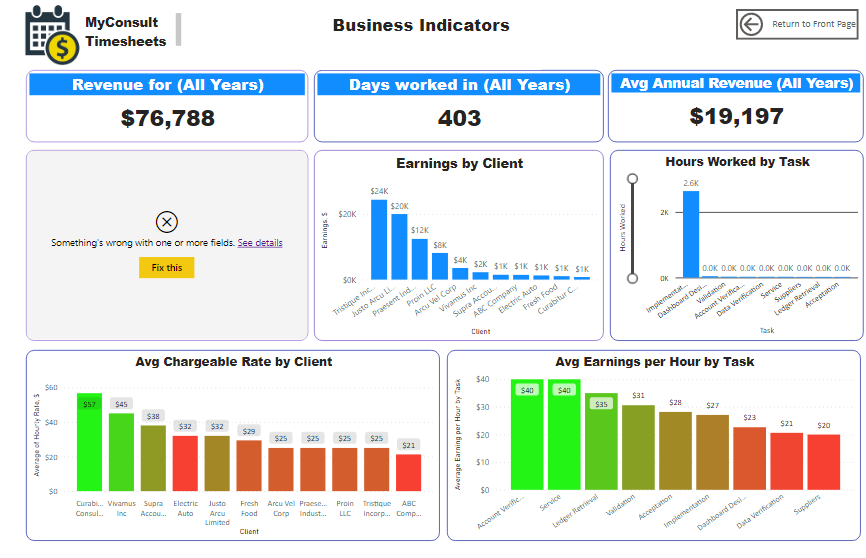
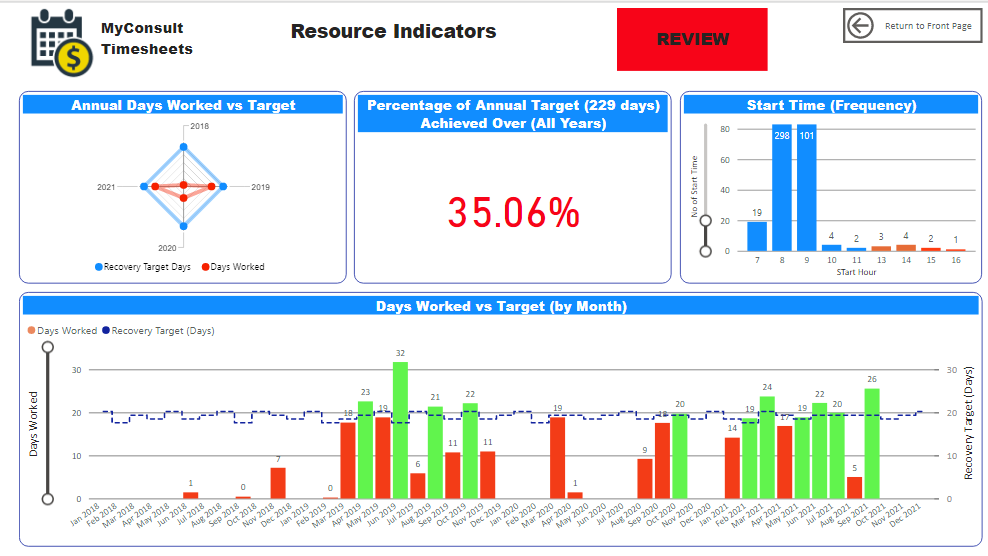
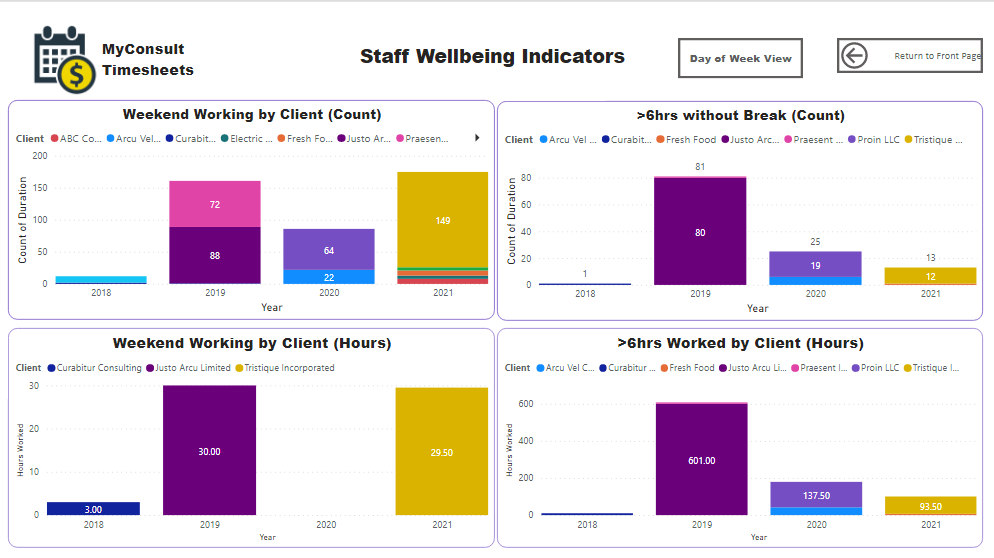
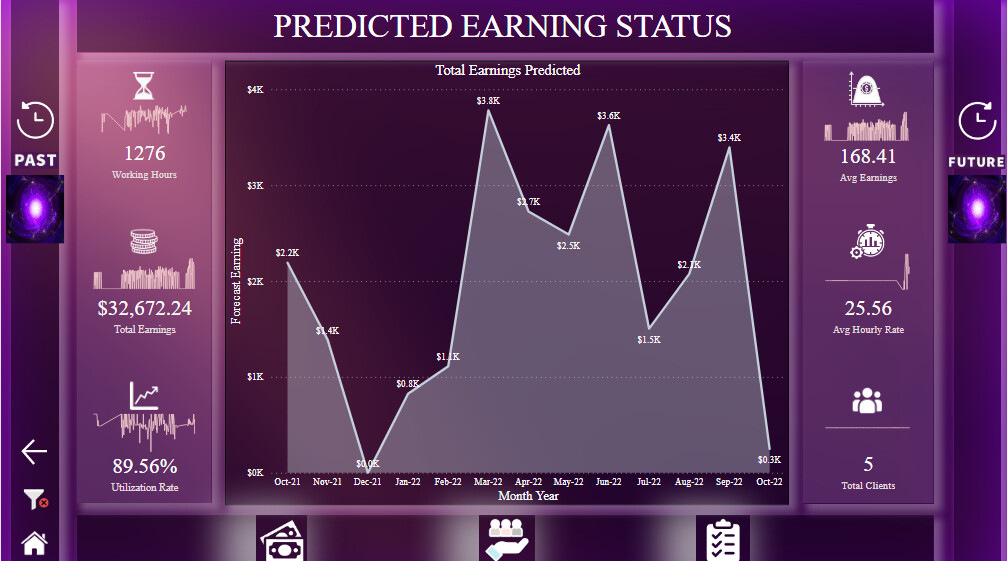
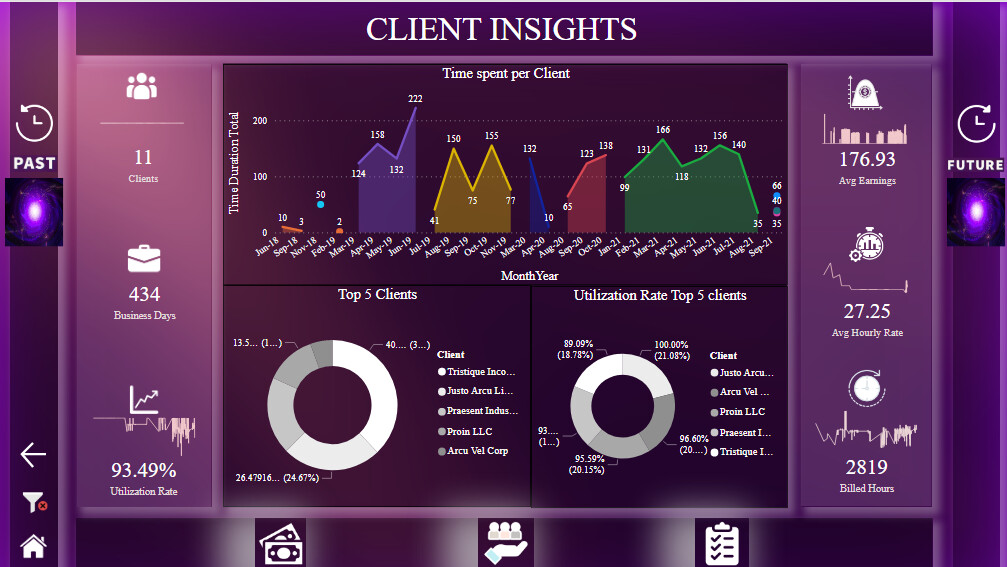
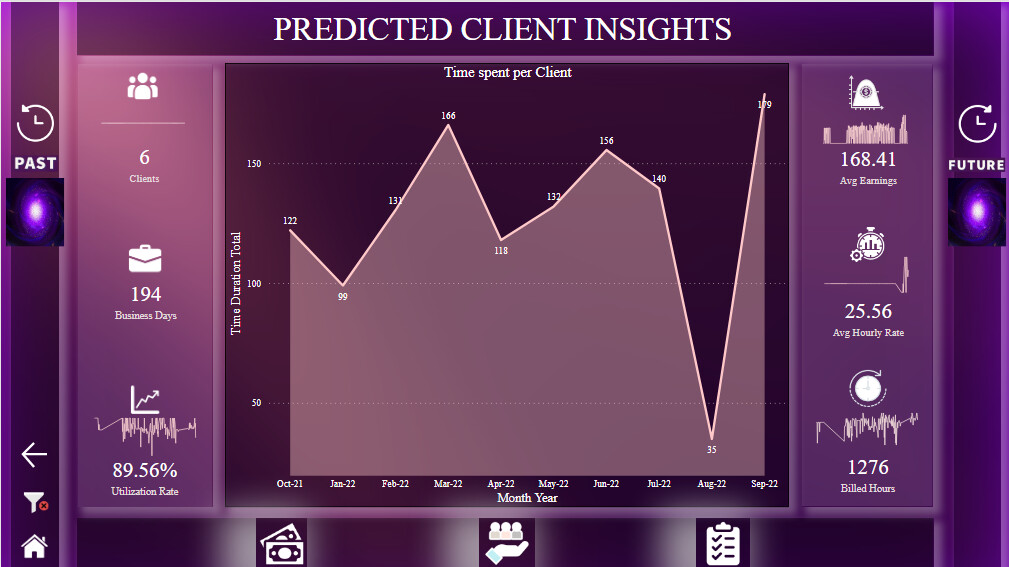
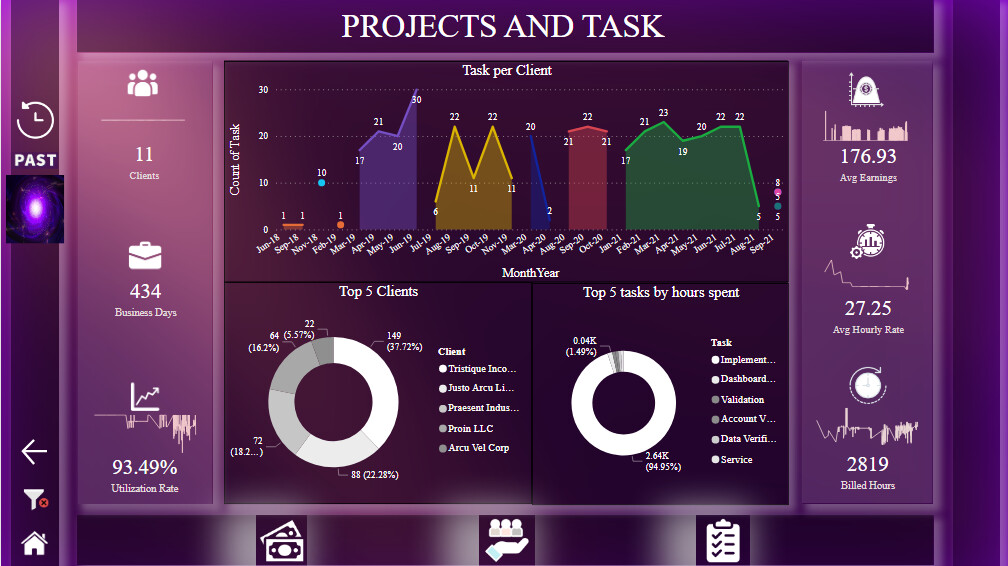
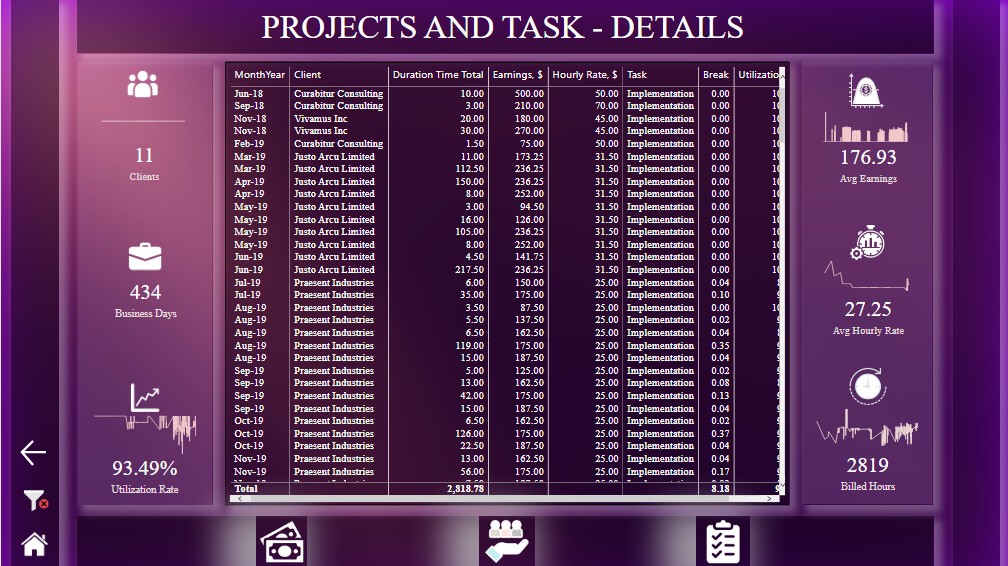
I have kept it very simple and have extracted some indicators that a consultancy manager is likely to be looking for - both for business improvement and resource management. I have assumed a single resource so have not used filters etc - as for the years, I have made the visuals (most - there are a couple of static ones) responsive.
I haven’t published this as I am don’t have a Pro license just yet and I am not sure if there is another way to do this - so my apologies in advance for this.
It would really be useful to get any feedback on this would be very much appreciated as it will only help me grow with PBI.
Thank you again for doing such a great job and providing novices like me opportunities to test and grow ourselves. Thank you so much!
1 Like
Here’s the entry from one of our non-member participants, David.
Here’s how David described it:
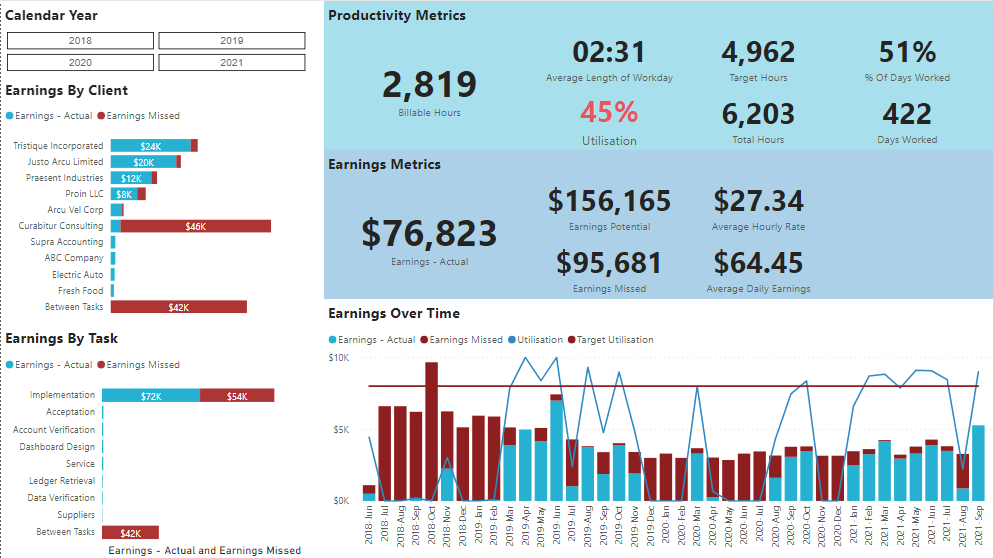
Couple of notes about how I have approached the task:
- The total hours calculation is based on the greater of the sum of:
- Duration + Break from the timesheet data
- A standard working day (7:30 hours)
- E.g. if the client worked 8 hours, with a 1 hour break, total hours for that day would be 9
- If the client worked 4 hours with no break, total hours would be 7:30
- Utilisation is based on the Duration column divided by the Total Hours calculation as per above
- Utilisation target is 80%
- Target hours is the total hours in any period * Utilisation target and represents the optimal number of billable hours in that period
- % of days worked is the number of distinct dates on the timesheet data, divided by the number of working days in any time period
Occasionally this is above 100% due to the client working weekends
Working days is based on UK bank holidays – could not find a reliable API for NZ holidays- I have assumed that the first and last date that a project appears is that project’s start/end date, and joined this info onto my date table to give a timeline of clients/gaps between jobs
- I have estimated potential lost earnings using the following logic:
- For any workdays where the client has not worked to the utilisation target, these hours are considered “Lost”
- I have a separate calculation that works out the last hourly rate the client was being paid at
- Earnings Missed is the sum of all the lost hours multiplied by the latest hourly rate
How this data has been presented:
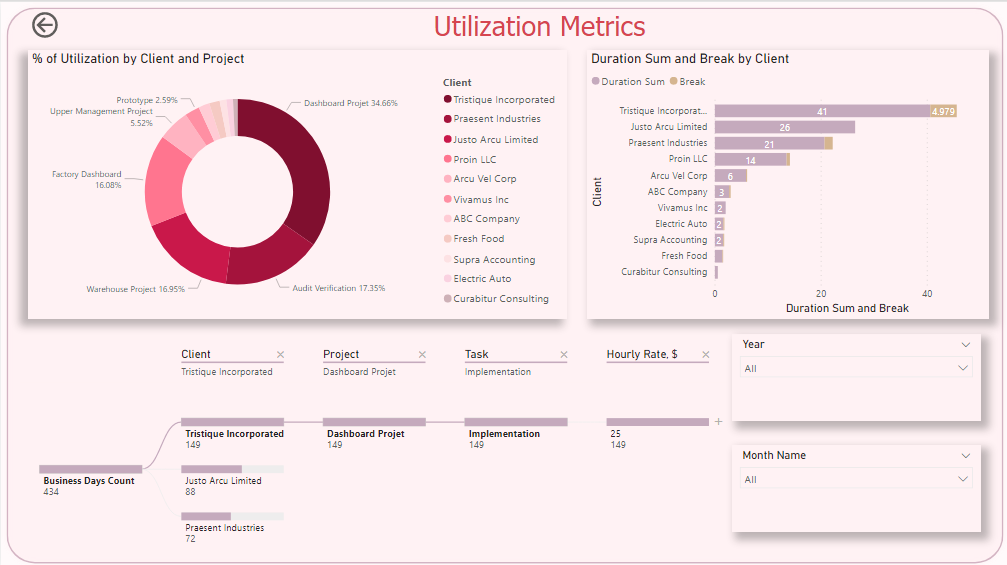
- Dash contains key metrics around earnings and productivity – can be sliced by year, client and task
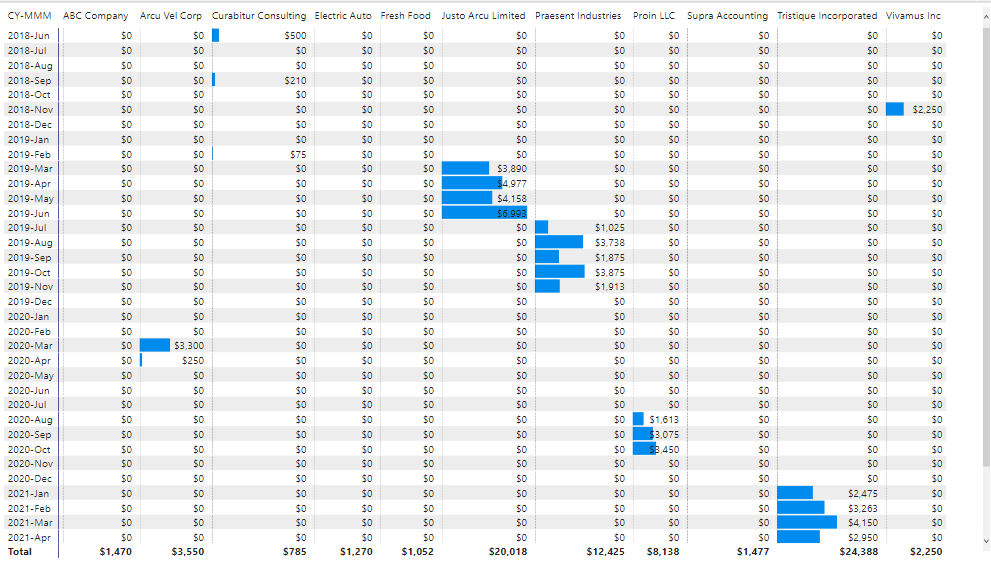
Graph at the bottom shows earnings (actual and missed) as well as utilisation (actual and target) over time- Earnings by client is a simple table showing where the client’s income comes from
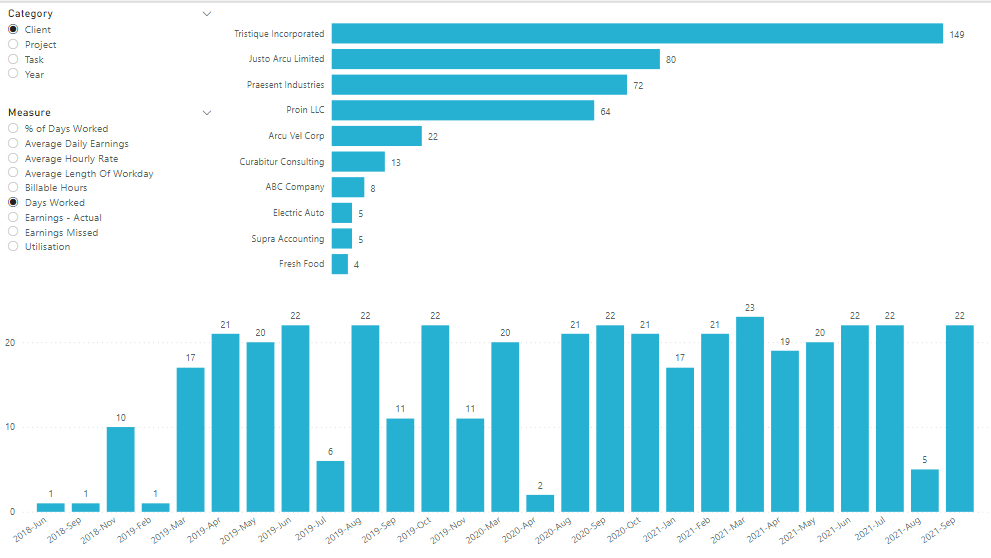
- Dynamic Stats allows the client to view a selection of metrics and split them by four categories: Client, Project, Task, Year
1 Like
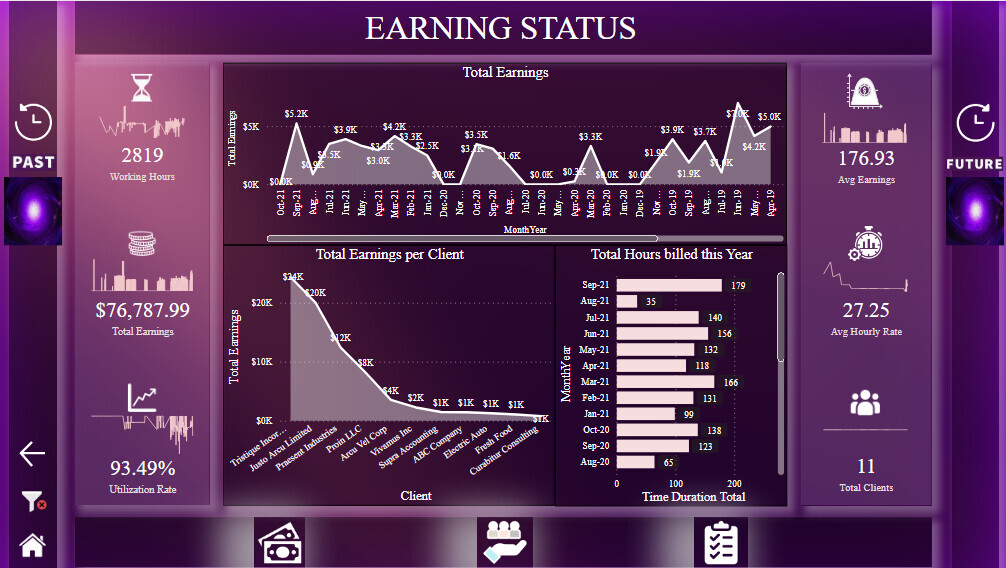
Here’s the entry from one of our non-member participants, Parag.
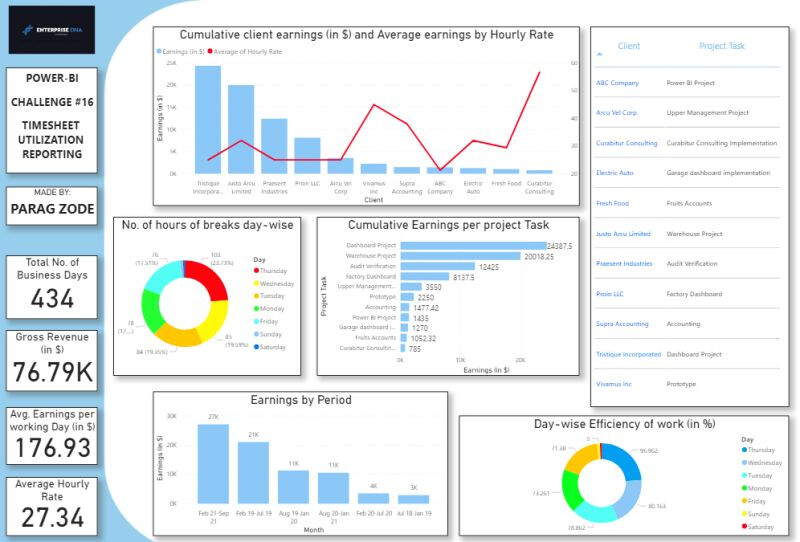
Here’s how Parag described it:
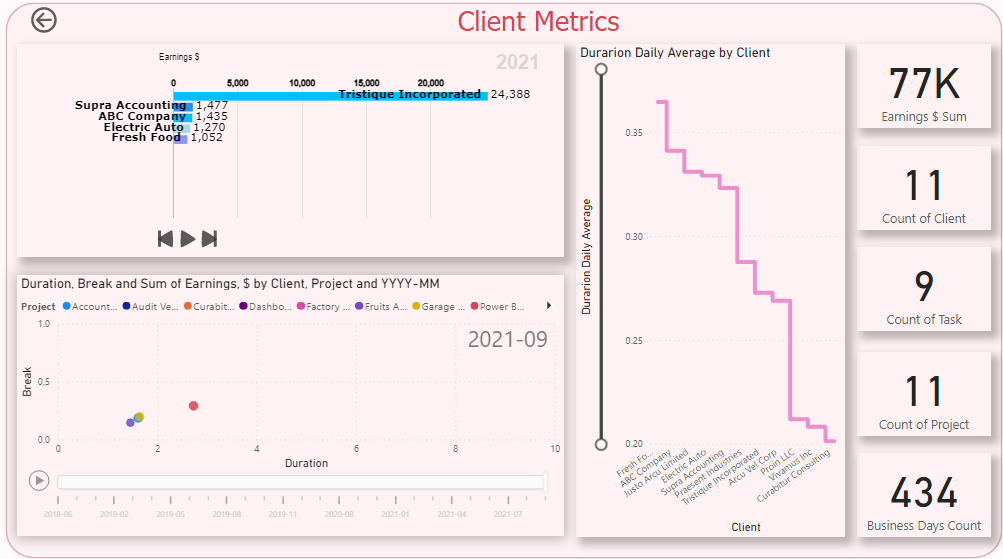
Few Key insights:
- Average rate paid per hour increases as cumulative client earnings decrease in most of the cases.
- Work-efficiency per day is directly proportional to the number of hours the breaks are taken. For instance, Thursday registers the most efficient day for work, but in hindsight, it registers most hours for breaks (103) from the data between June 2018-September 2021.
So, more no. of breaks ensures more efficiency in work and vice-versa.- The highest cumulative earnings were done between the period of February 2021-September 2021.