The Power BI Challenge is not about winning, but more about learning and improving Power BI and analytical skills.
One of our non-members is going back to the challenges.
Here’s Shakir’s entry for Power BI Challenge 16.
In this report you would find the following:
- Actual analysis and What analysis separated with a button, by default it show Actual analytics
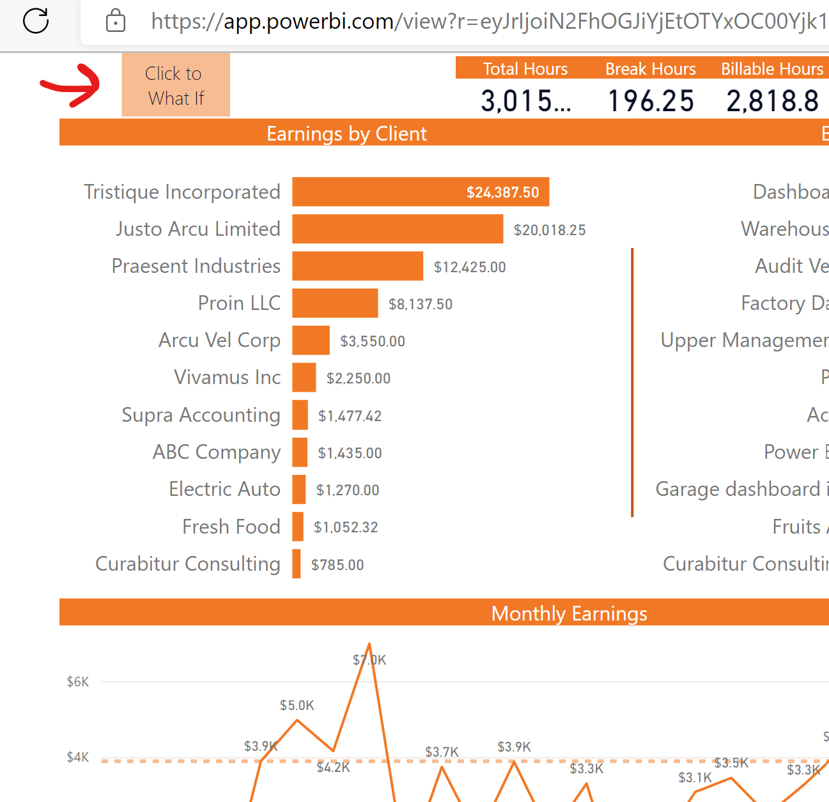
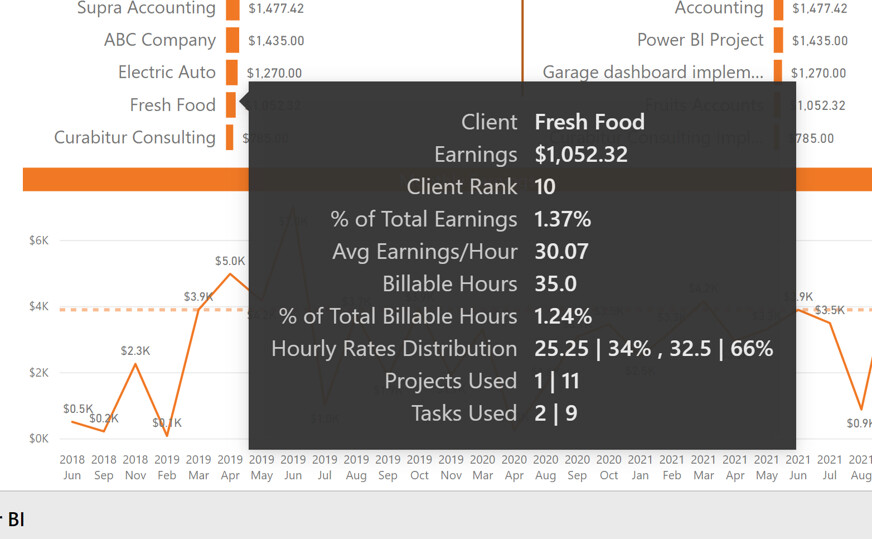
- Under Actual Page, for “Earnings for Client”, you would tooltip to be particularly interesting, especially the last three entries
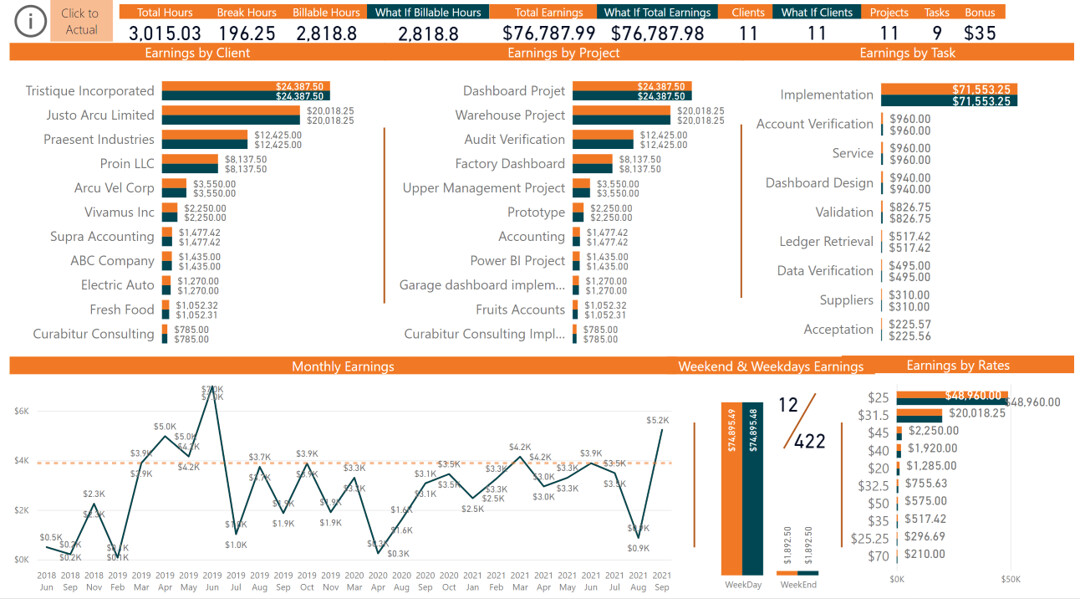
- If press “Click to What If”, to the visuals What If comparisons are added for:
all 10 rates;
collective rate;
billables hours;
add new client based on existing client;
days off set to see impact on Weekend and weekdays
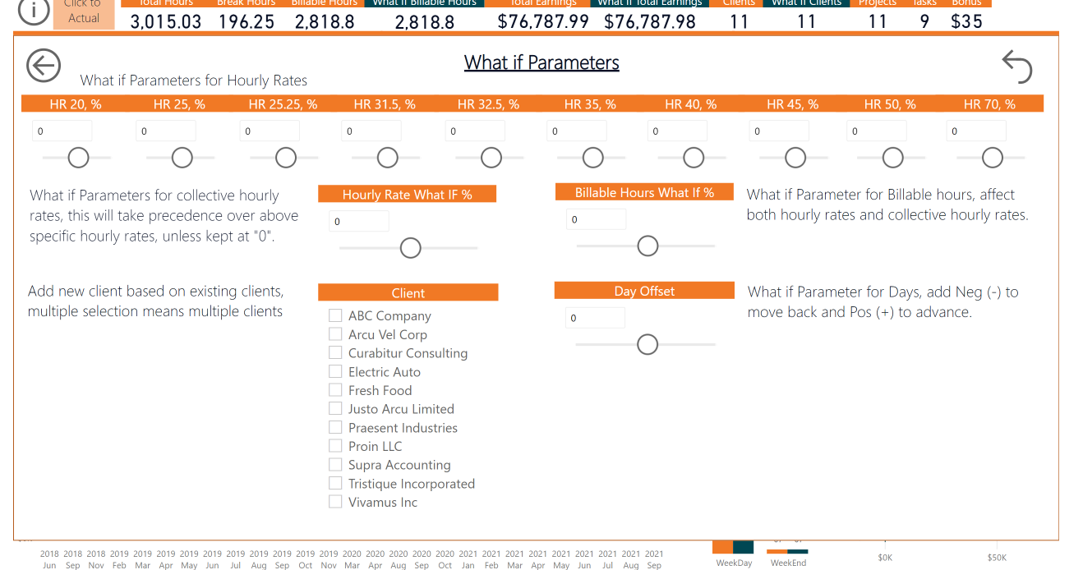
All of the above can be changed under “What If Parameter” window
- What if Parameter windows
To learn about the real-life scenario presented for the challenge, be sure to click on the image below.
