Here’s Kim’s entry for Power BI Challenge 16. @KimC, feel free to add other details of your work.
Here’s how Kim described it:
Here is my entry for Challenge#16.
Overall I am happy with my entry and learning progression.
Likes:
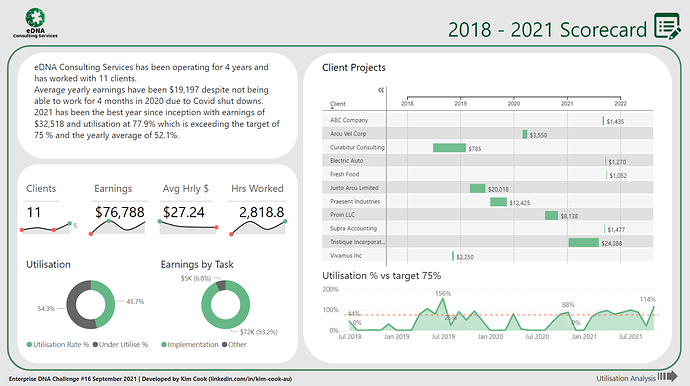
Smart Narrative. First time using this feature and I love it; it really helped to tell the story and tie my visuals together. Thanks to @Greg for his video
focused on a simple colour scheme
Dynamic page headers
Other new features I tried were: Gantt, Tornado & Sparklines.
Dislikes:
I am too slow and I have spent too much time on this dashboard.
Brevity of data and it took me some time to decide how to present report. However, this was also a like as I couldn’t get distracted with too many ideas like I usually do.
To learn about the real-life scenario presented for the challenge, be sure to click on the image below.
This post is part of the Enterprise DNA platform improvements. Through these posts, members and non-members can showcase the resources and inspirations on how they come up with their challenge submissions. We hope all members can utilize it efficiently.
Really like how you have utilized the custom visuals here to create the sparklines. I think that this is a superb design for these types of insights. It just adds a little bit more value than just having a card or visualization with a number. Sometimes I’ve just used a line chart for that but it seems to be nice and clean using that custom visual.
This just looks like a real reporting application. Particularly how you created the border around the grids and also you’ve had your titles and labeling information outside of that border. This is a nice design I definitely a that I might steal for a future project that I work on or a future challenge I think.
Also the way you’ve used text and I presume that that is dynamic as well. So that’s really nice and a great use of the new dynamic text feature that we have available to us.
I just love a lot of the additional information that you have placed into your report. You haven’t just stuck with the visuals you have thought of it deeper about adding that little bit extra labeling and also analysis that provides a user with a lot more context around what the key insights are.
You’ve reminded me I need to play around with the Smart Narrative visual more, such a great resource that I’ve not utilised.
“I am too slow and I have spent too much time on this dashboard” - Don’t worry, that will improve with time & practice, besides “Fast is fine but accuracy is everything”.
You know how every measure has an implicit CALCULATE statement wrapped around it that you don’t see? Every one of my reports has an implicit “I am too slow and I have spent too much time on this dashboard” wrapped around it as well …
Terrific report though, and I can really see your progression through your challenge entries. Keep up the great work!