Here’s Hossein’s entry for Power BI Challenge 16. @sedhosen, feel free to add other details of your work.
Here’s how Hossein described it:
Hi All,
Hope everything is well.
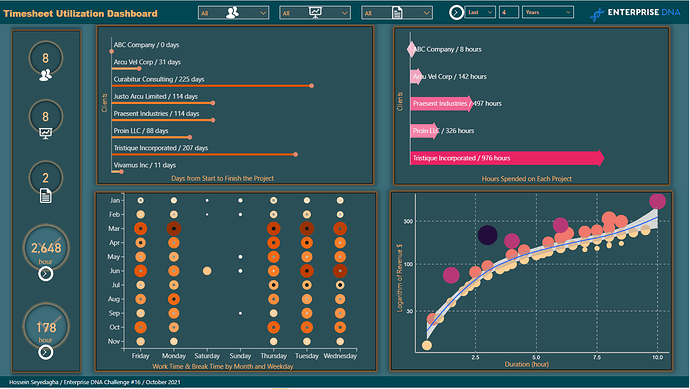
Here is my submission for eDNA Challenge #16. It was so fun, and I learned a lot by making this report. I learned a lot about R graphs, ‘ggplot’ and ‘tidyverse’ libraries, and also learned how to use charticulator to make nice charts using both web and custom visual versions. Unfortunately, I missed the deadline, and I couldn’t spend much time designing it as I wanted, but I could make new graphs using charticulator and R.
To learn about the real-life scenario presented for the challenge, be sure to click on the image below.
