Here’s Eric’s entry for Power BI Challenge 16. @ericet, feel free to add other details of your work.
Here’s how Eric described it:
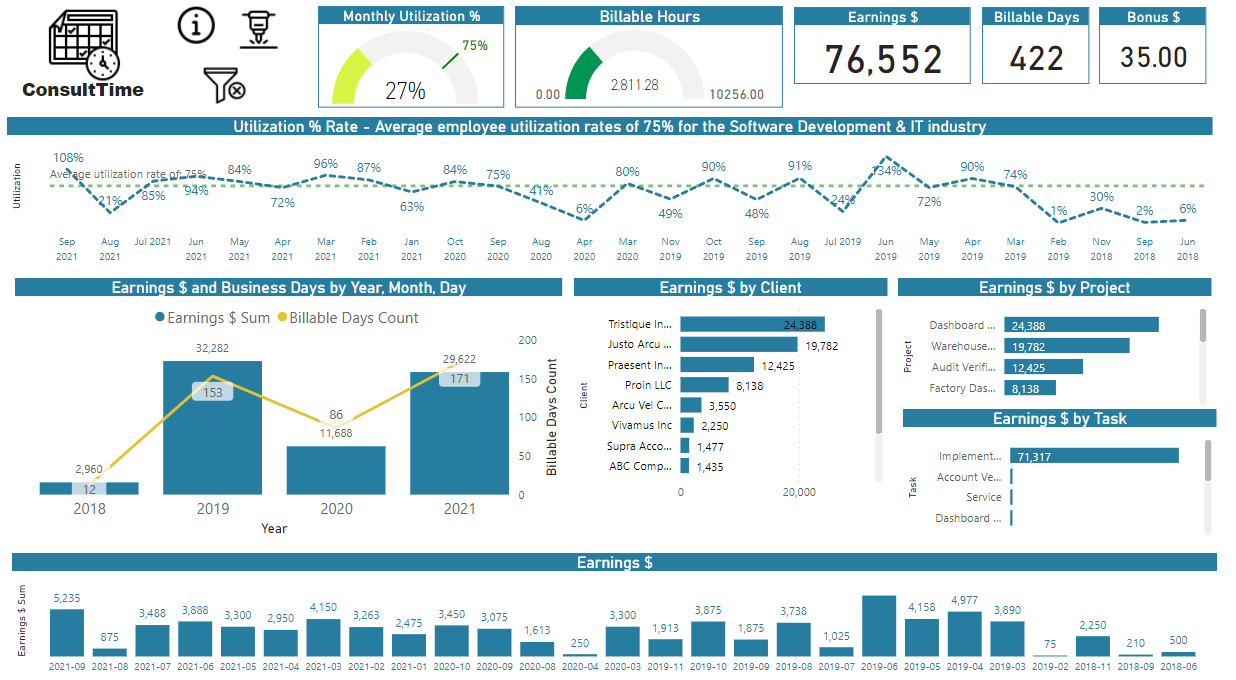
ConsultTime, Timesheet Utilization Tool for Consultants.
This dashboard is for consultants who want to track their business. You can have multiple customers (clients) and hourly rates.
Fully interactive report, drill down on many visualisation.
Utilization % Rate KPI to clearly see how the consultant is maximising his time and billing.
This report is based on a monthly period, consultants usually bill monthly.
I use atWork Timesheet on iOS to track my time.
The export data file format is easy and require small modifications on the header and footer of the file. I also added an extra column. Hours per Day was added to the original data file. Not all customers have the same day definition. 7, 7.5, 8 hours per day. The regular work day was added to be able to calculate utilization % rate.
Utilization KPI Definition
Utilization = Billable hours / Total hours X 100%
Utilization target is set at 75%. Which is the average employee utilization rates for the software development and IT industry
To learn about the real-life scenario presented for the challenge, be sure to click on the image below.

2 Likes
This post is part of the Enterprise DNA platform improvements. Through these posts, members and non-members can showcase the resources and inspirations on how they come up with their challenge submissions. We hope all members can utilize it efficiently.
Super work Eric. Thanks for getting involved in the challenge. To me by looking at the insights you’ve definitely laid out most of the key pieces of analysis that you’d want to see. I think though that some of the visualizations could be improved. At least how you have brought them together in this particular report page. To me some of the visualizations could be summarized in a more condensed way or maybe even through a more creative feature like the tooltips feature.
One of the things that you want to do with your analysis is take users through a journey. Tell them a story by starting out off at a high level but then enabling them to get down to a granular level of insights. I feel like everything’s a bit jumbled here so just something to have a think about and the future. I love also the icons you’ve used by the way but maybe sitting them out in a more a structured way rather than just placing them all together might have been a better way to utilize them
Definitely love to start that you’ve made here to your participations in the challenge. I really recommend diving into more and trying out more features. Almost experimenting during your submissions. That’s how you’re going to learn super quick.
Sam
1 Like