Here’s Diana’s entry for Power BI Challenge 16. @DianaWill, feel free to add other details of your work.
To learn about the real-life scenario presented for the challenge, be sure to click on the image below.

Here’s Diana’s entry for Power BI Challenge 16. @DianaWill, feel free to add other details of your work.
To learn about the real-life scenario presented for the challenge, be sure to click on the image below.
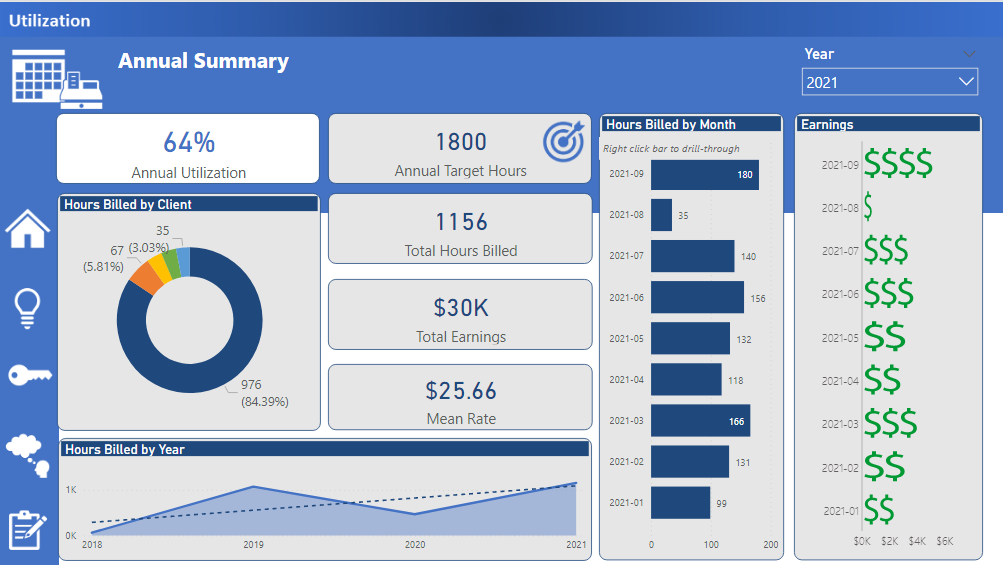
What a fun challenge! I had fun with a colorful design (Office 2016 theme) and AI visualizations. But, the center of the report is utilization.
I do not provide a cover or menu page because I find my users want to get right to the results so I start with a summary page. The monthly drill down is not pictured above.
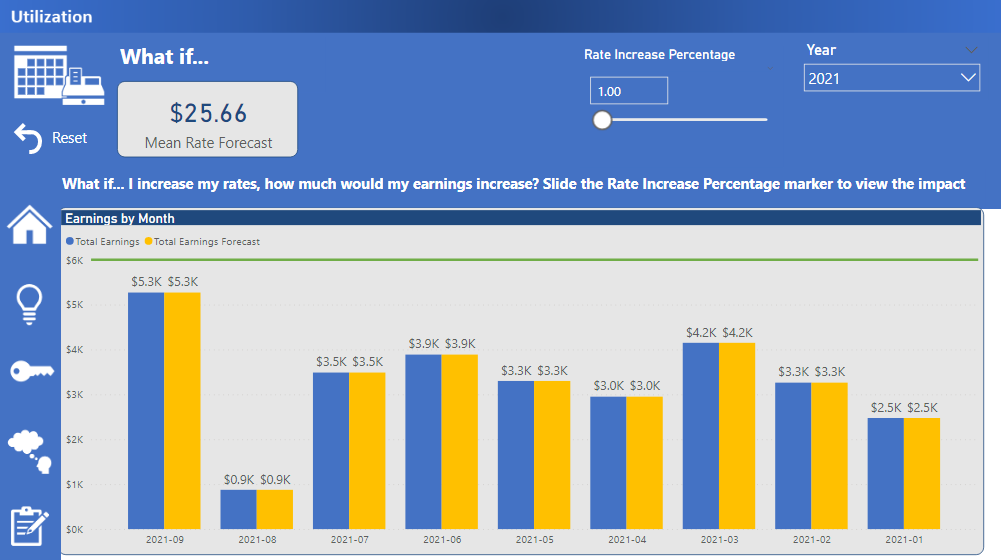
The What if page is my favorite. I need to implement this type of analysis more in my ‘real’ work.
Assumptions:
Model Modifications:
Observations:
Learning Opportunities:
Nice one Diana. What I really like about this the most is the clean navigation that you’ve created and implemented in your report. You’ve used some simple colours alongside great icons and the flow for the consumer is top-quality.
Really like how you have used some of the advanced visualisation’s to do all the hard work for you on the analytical side. I’ve been exploring these visualisation small myself recently and am very impressed.
I think you’re really showing all of the key insights here that was required from the challenge. So I commend Are you on developing a complete application here that would look great in any business environment.
Appreciate the write-up as well. I’m glad you enjoyed working through the scenario and participating in the challenge.
Can’t wait to see more from you in the future.
Sam