Here’s the entry from one of our non-member participants, David.
Here’s how David described it:
Couple of notes about how I have approached the task:
The total hours calculation is based on the greater of the sum of:
- Duration + Break from the timesheet data
- A standard working day (7:30 hours)
- E.g. if the client worked 8 hours, with a 1 hour break, total hours for that day would be 9
- If the client worked 4 hours with no break, total hours would be 7:30
Utilisation is based on the Duration column divided by the Total Hours calculation as per above
Utilisation target is 80%
Target hours is the total hours in any period * Utilisation target and represents the optimal number of billable hours in that period
% of days worked is the number of distinct dates on the timesheet data, divided by the number of working days in any time period
Occasionally this is above 100% due to the client working weekends
Working days is based on UK bank holidays – could not find a reliable API for NZ holidaysI have assumed that the first and last date that a project appears is that project’s start/end date, and joined this info onto my date table to give a timeline of clients/gaps between jobs
I have estimated potential lost earnings using the following logic:
- For any workdays where the client has not worked to the utilisation target, these hours are considered “Lost”
- I have a separate calculation that works out the last hourly rate the client was being paid at
- Earnings Missed is the sum of all the lost hours multiplied by the latest hourly rate
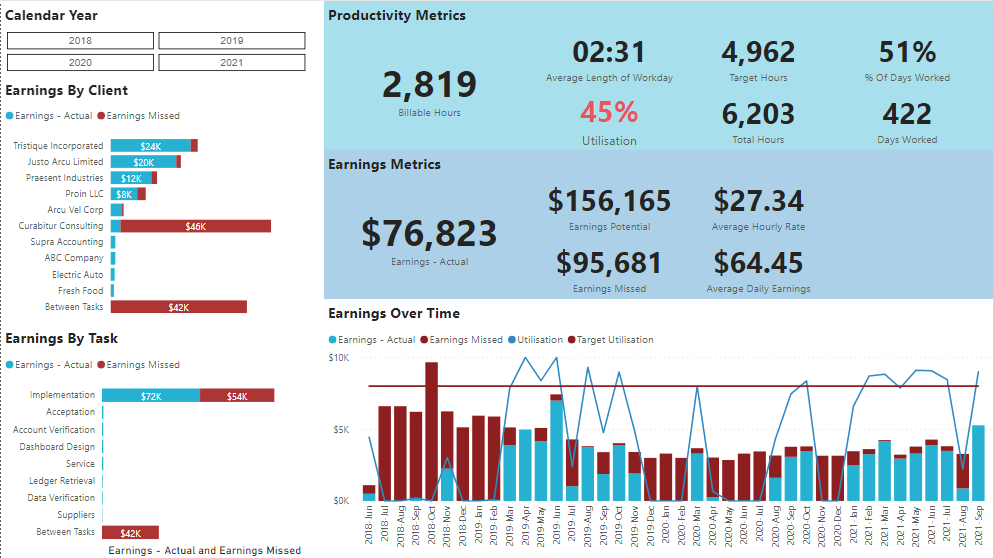
How this data has been presented:
- Dash contains key metrics around earnings and productivity – can be sliced by year, client and task
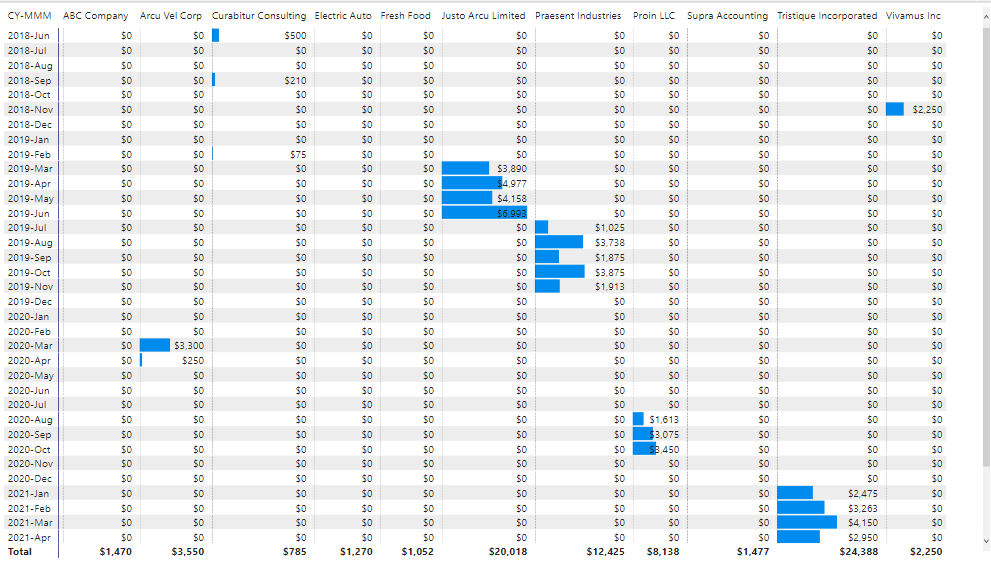
Graph at the bottom shows earnings (actual and missed) as well as utilisation (actual and target) over time- Earnings by client is a simple table showing where the client’s income comes from
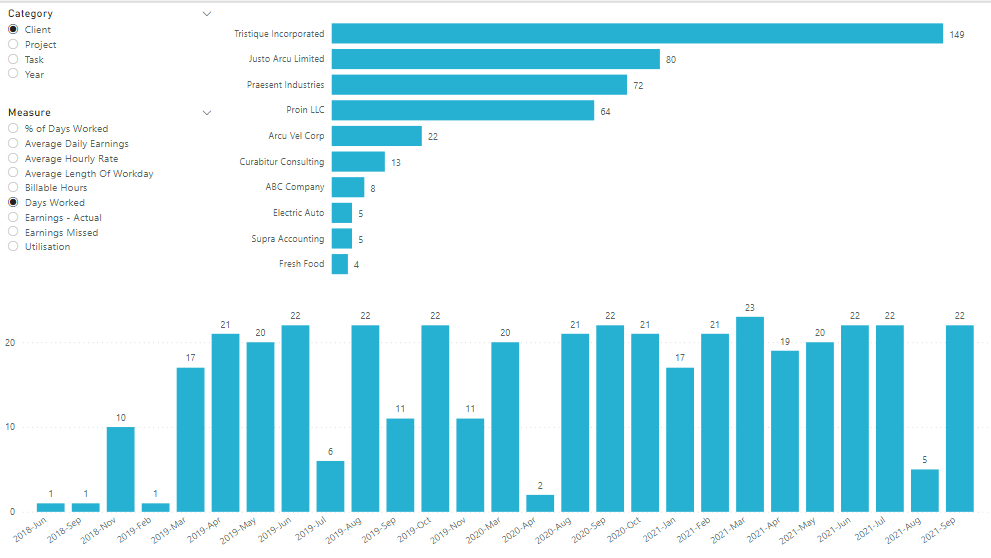
- Dynamic Stats allows the client to view a selection of metrics and split them by four categories: Client, Project, Task, Year
To learn about the real-life scenario presented for the challenge, be sure to click on the image below.
