Here’s David’s entry for Power BI Challenge 16. @davidcenna, feel free to add other details of your work.
Here’s how David described it:
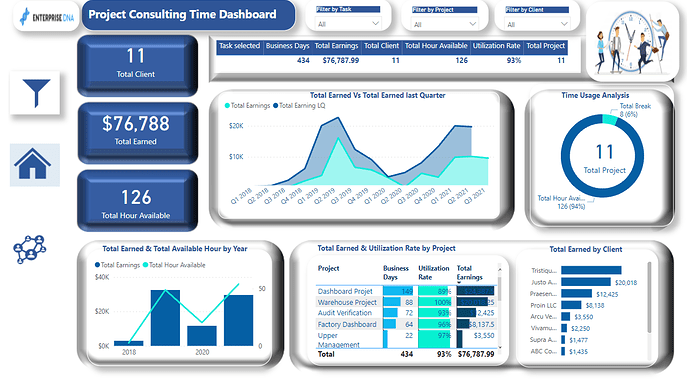
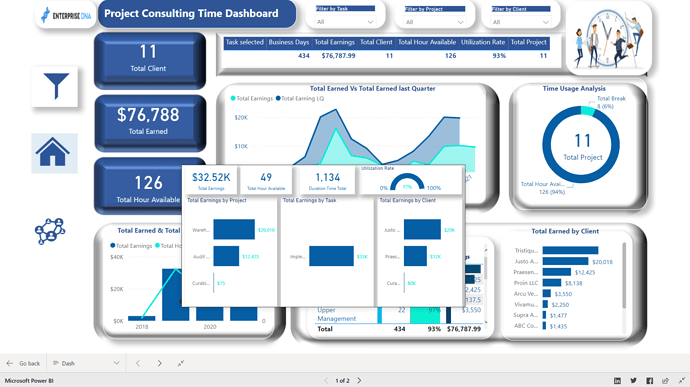
This report tries to analyze the total money earned per each task and by project executed by the company and create an avenue to drill down to the total earned accumulated from organization client over time.
Each task’s duration (Time utilization rate) was analyzed and compared with the total amount of money earned on each project and the total number of days it took the organization to finish the project.
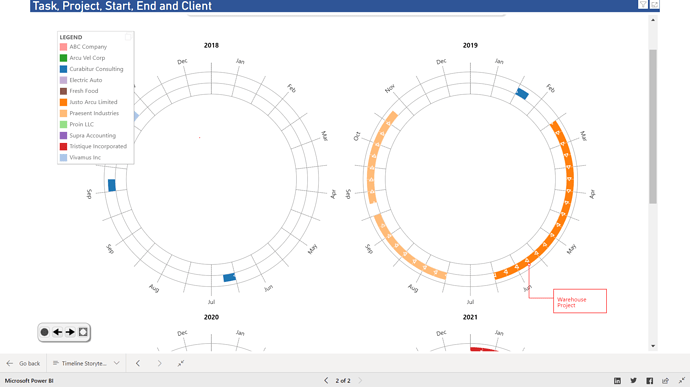
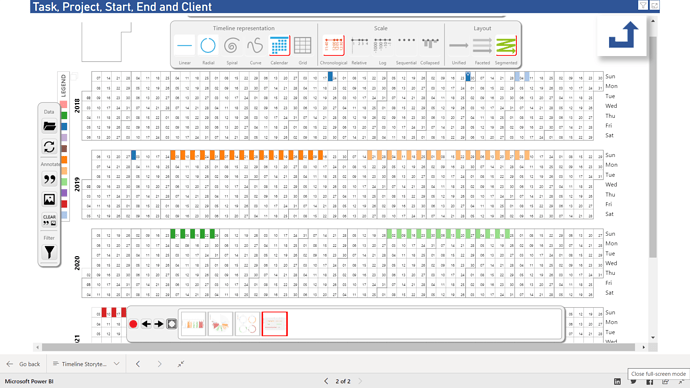
Also, this report looks at the Timeline story of each project executed by day, month, and year in respect to the client, project type, and categorization by task. This was achieved by using the Timeline storyteller visual. It helps to bring the summary of all the years activities into a single page of visual.
To learn about the real-life scenario presented for the challenge, be sure to click on the image below.
