Power BI Challenge 11 - Covid 19 Reporting from Sue (Newcomer)

Here’s Sue’s entry for Power BI Challenge 11. @Sue, feel free to add other details of your work.

Here’s the link to the report:

Here’s how Sue described it:

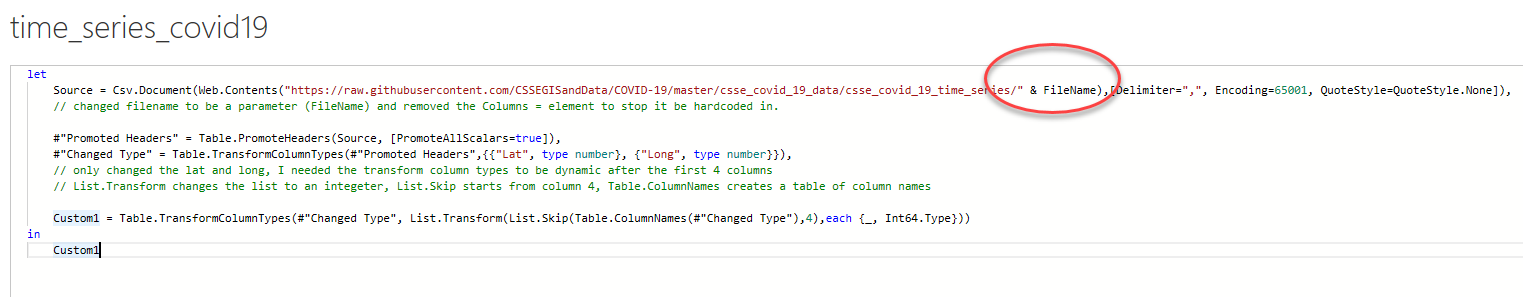
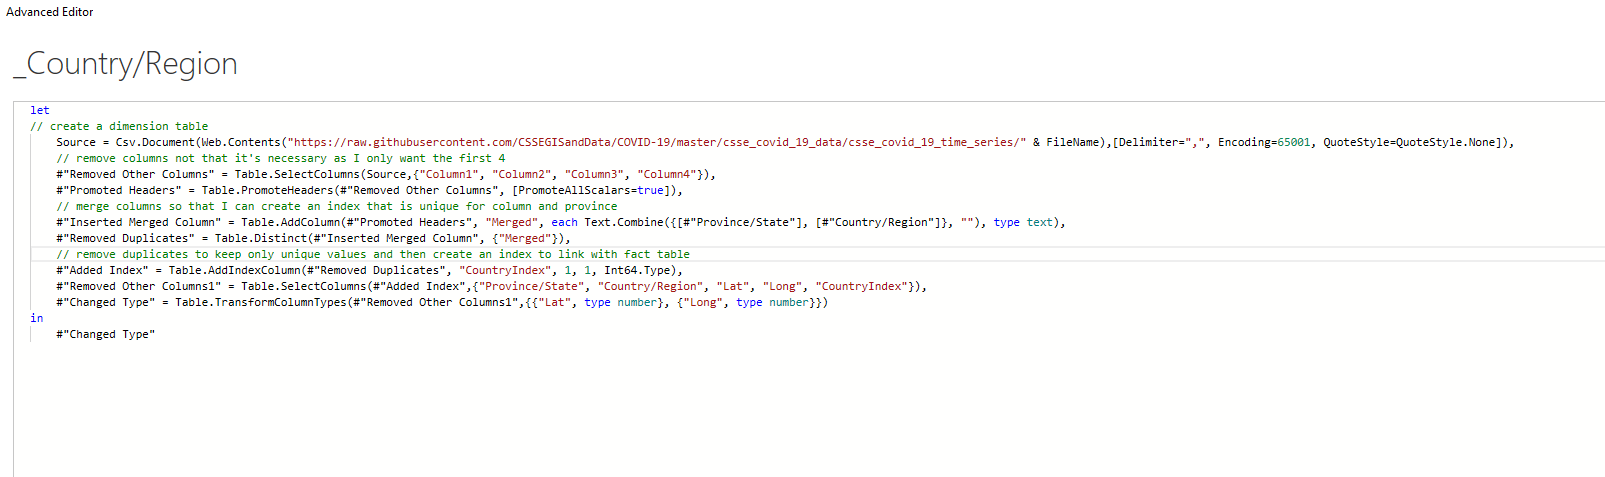
Step 1 – created a query to pull in the first data set. Created a parameter for a filename. Then changed the filename in the query to the parameter filename, and ensured that the query would dynamically pull in all the columns as the data is added to.

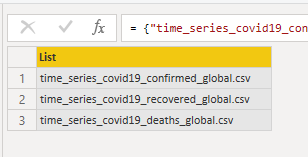
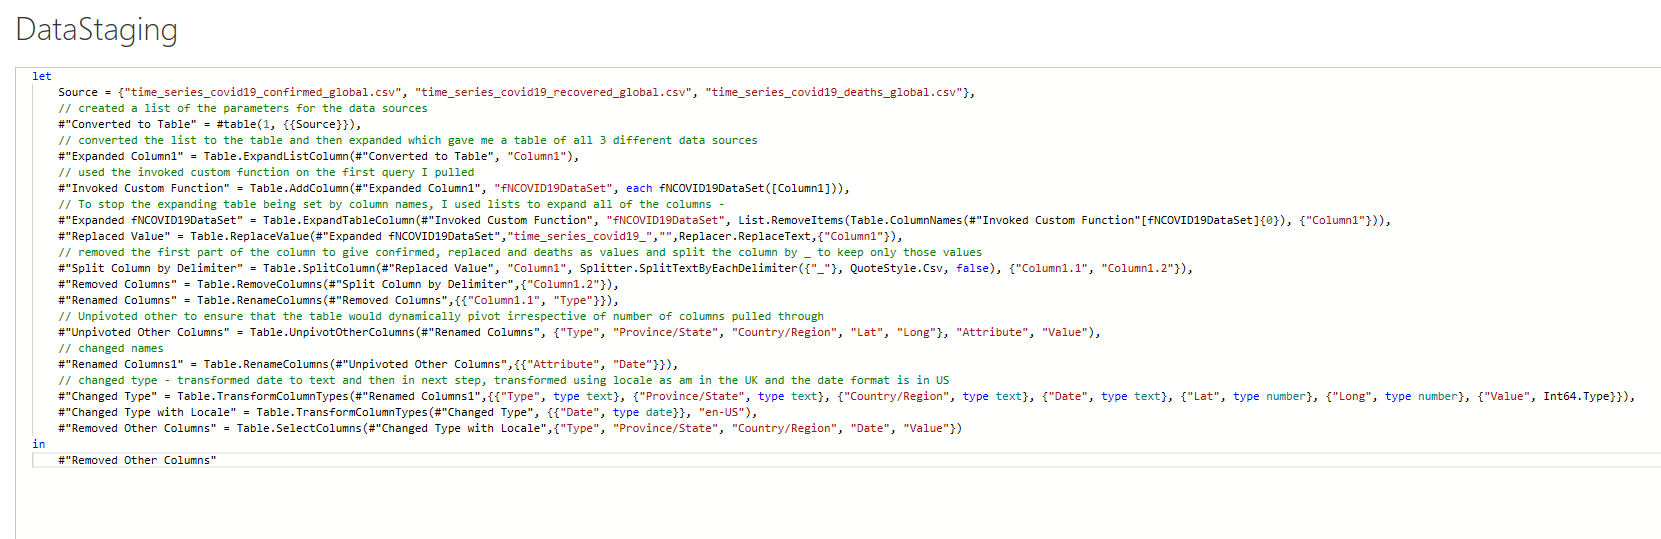
Step 2 - I then created a list of the different sources that I wanted to pull in and expanded the first query for each file name. I’ve commented the steps in Power Query code below and attached a copy of the .pbix file. This is a useful example to follow from Guy in A Cube in how to do the custom function part.

2

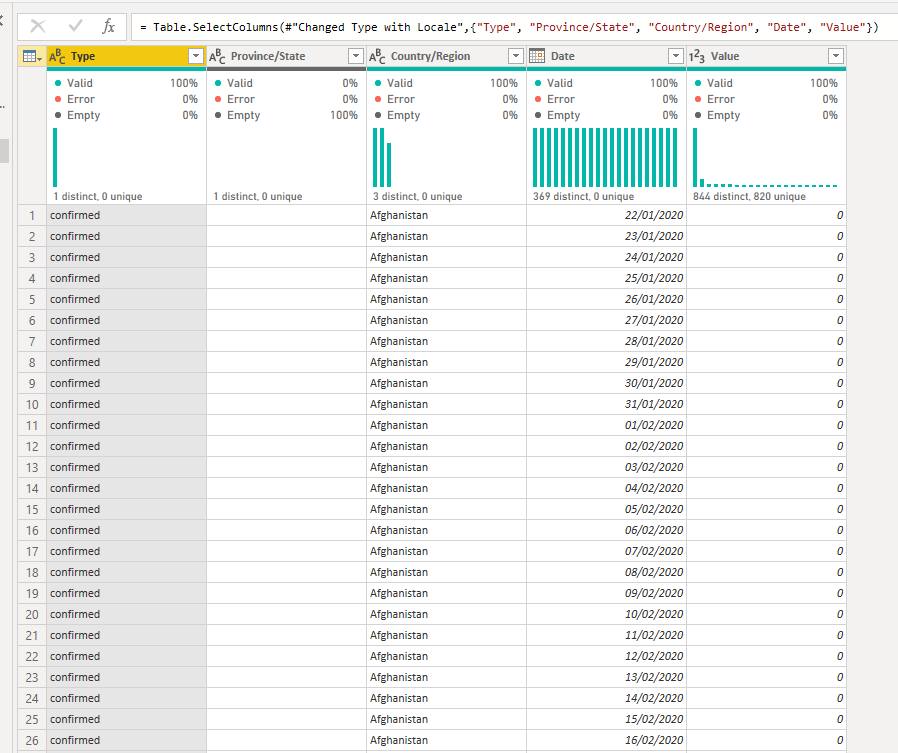
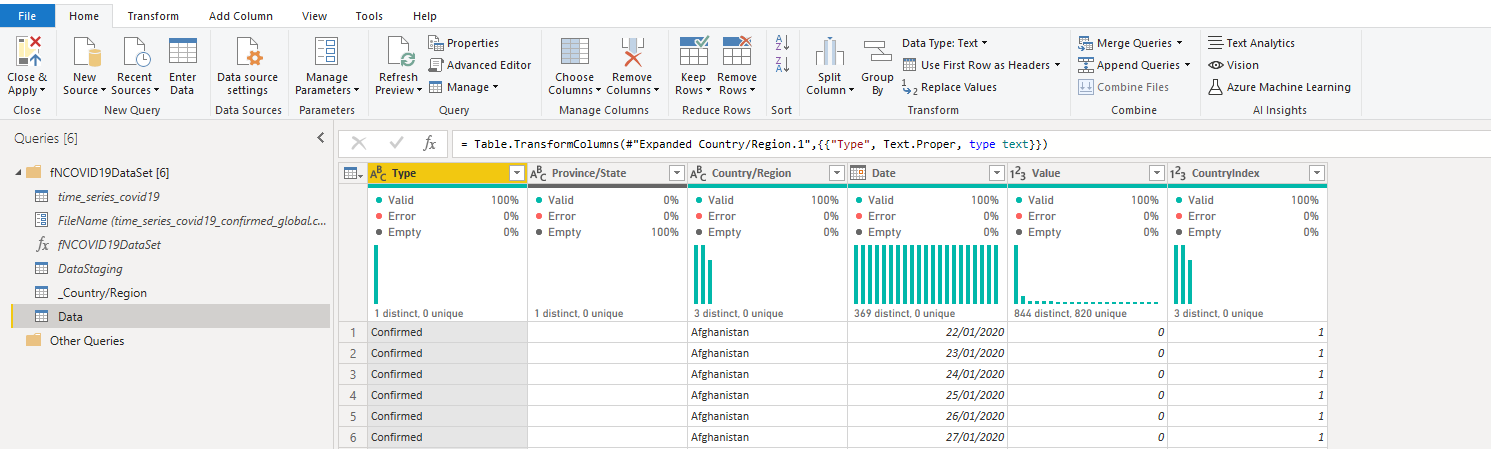
You end up with a table like this.

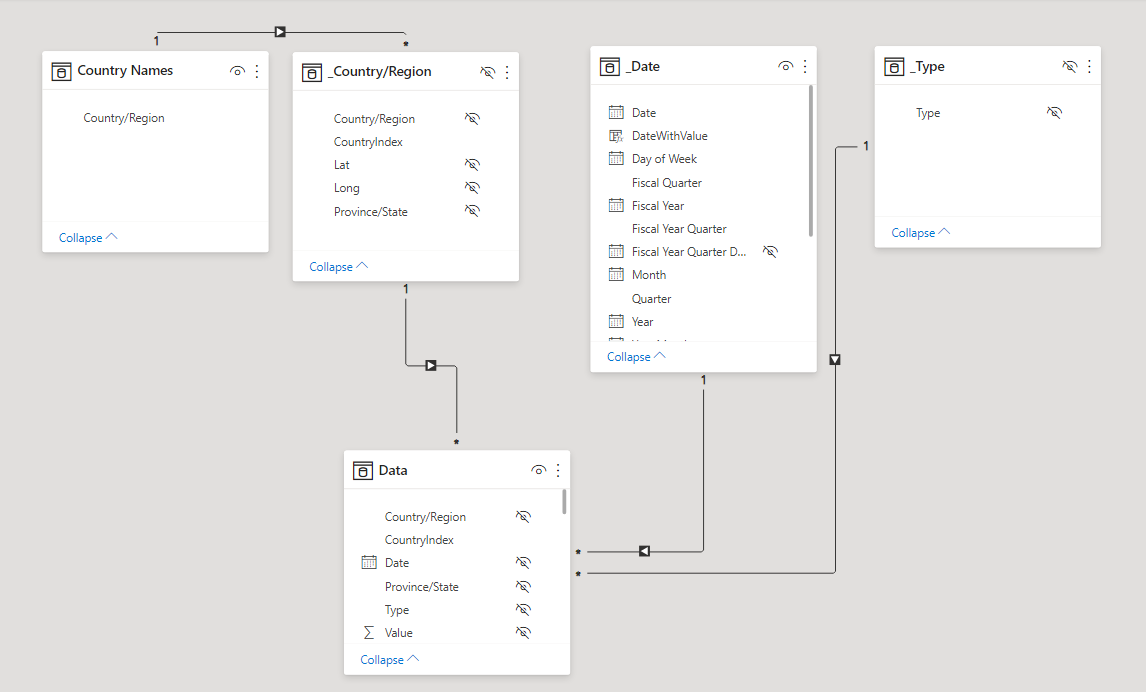
I then created a dimension table of countries and Region with an index:

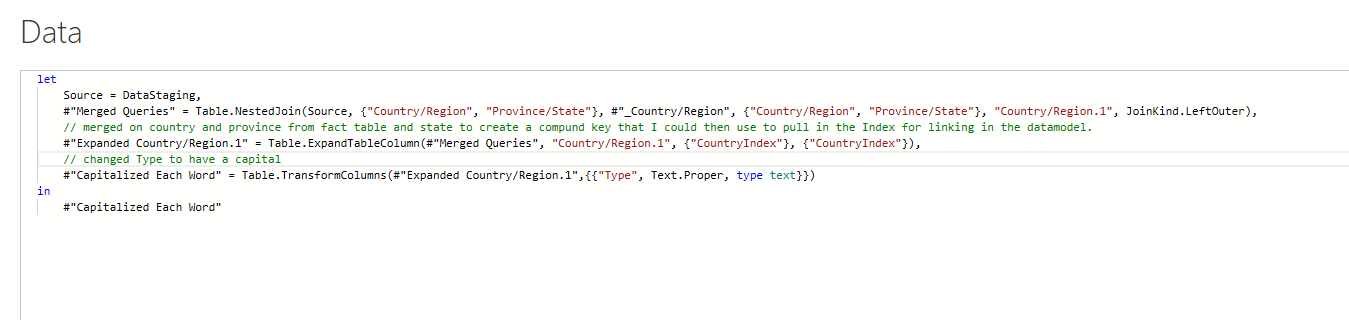
Then I wanted to be able to link my fact table with my country table so created a merge and pulled in the Index to the fact table.

This was a fairly iterative process which I refined over time to ensure my model worked.

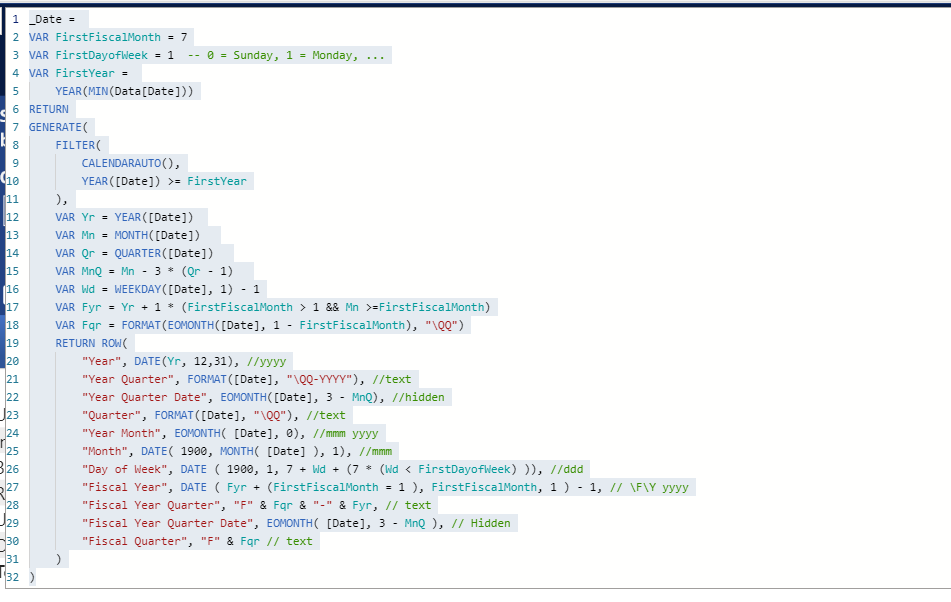
Once loaded into the data model, I created a date table using CalendarAuto in DAX:

I then started to create my measures. The numbers are cumulative so rather than using sum for my first measure I used Max to get my total. I could then use start to use calculate to Filter by Confirmed, Recovered and Deaths.

To use the visual bars only in the conditional formatting, I used exactly the same measures but called them a different name, eg Total Confirmed M.

I wanted to make the visual as simple as possible so had seen a video about ranking by sqlbi.com1 so used that as a basis to write some ranking measures. I would find it difficult to explain it in as clear way so definitely worth watching.

I created a table called TopN (TopN = GENERATESERIES(0, 200, 1)which generated a series of numbers from 1 to 200. There are 193 different country entries.

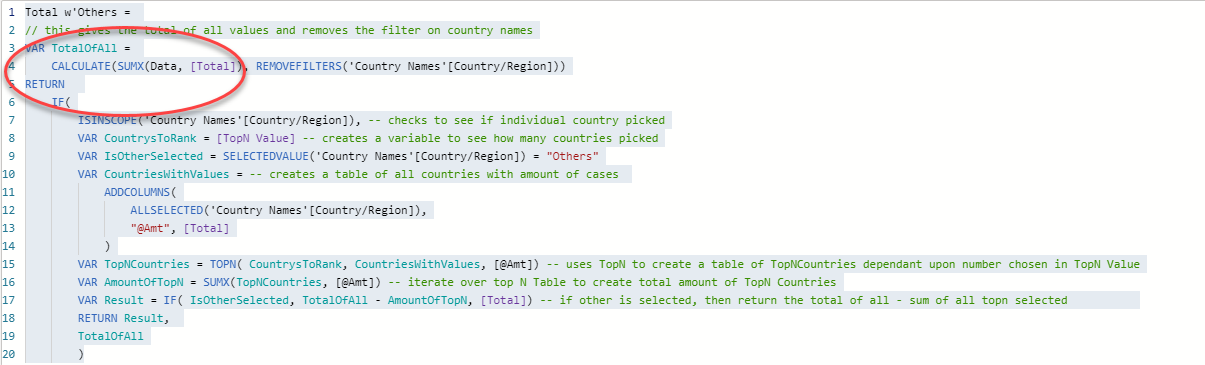
The main difference in my code, compared to the example, is that I was using Max not Sum, so had to change a few items in the Total w’Others measure.

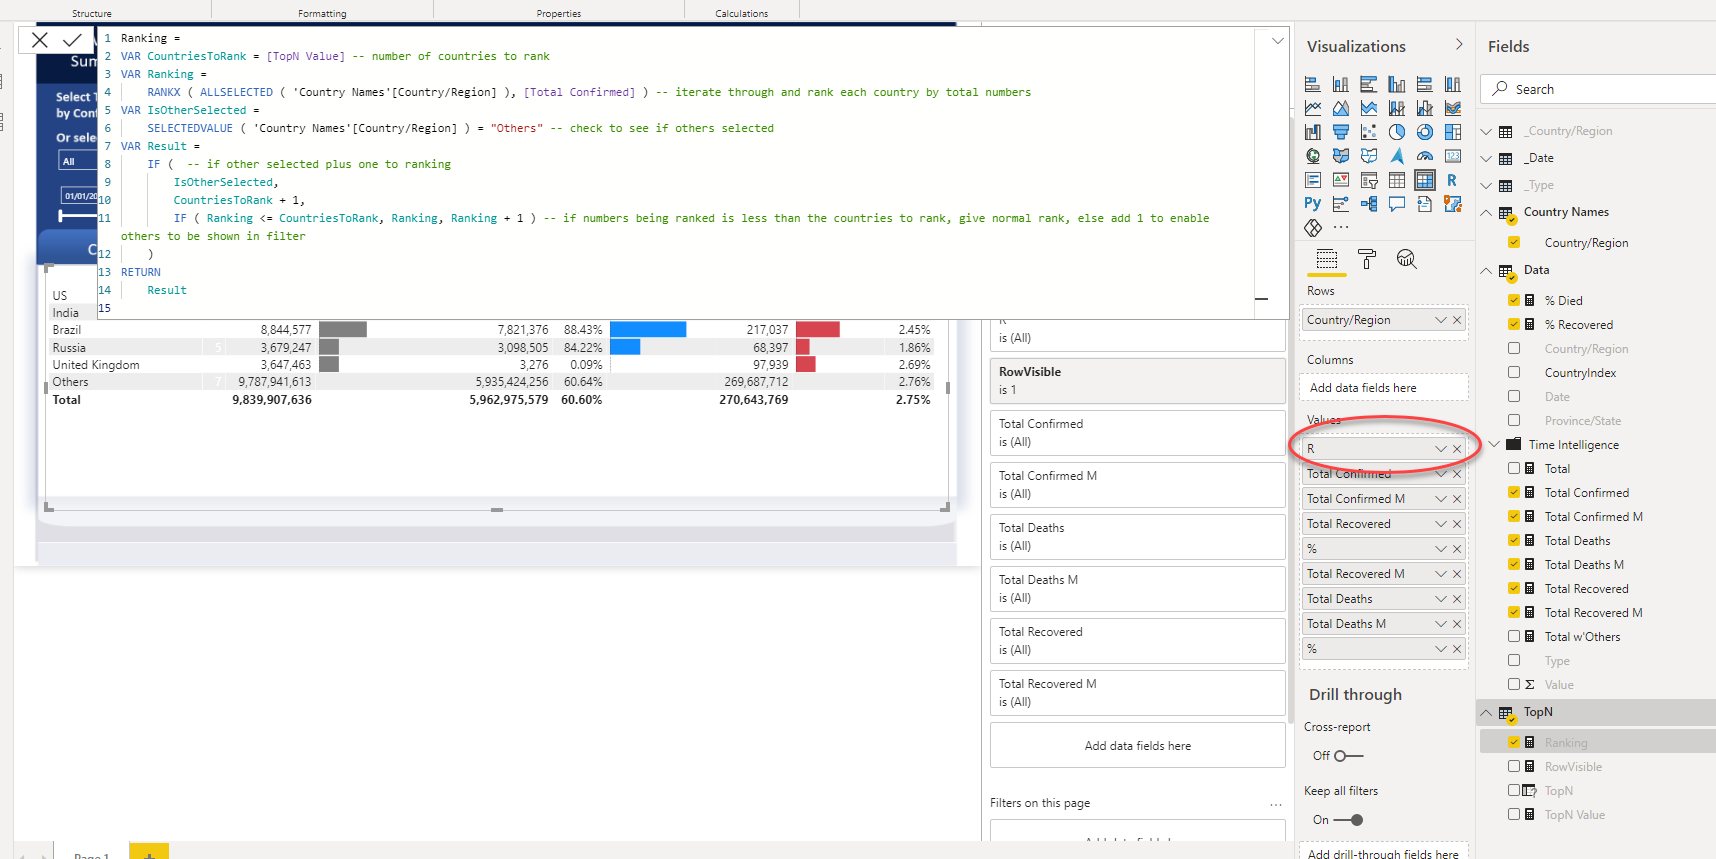
My visuals are all fairly simple, I used a Ranking measure to sort the matrix so that Others would be at the end of the table irrespective of number of countries chosen.

Then to stop the Ranking table being visible I used the Field formatting to hide the field by giving it the same colour as the background.

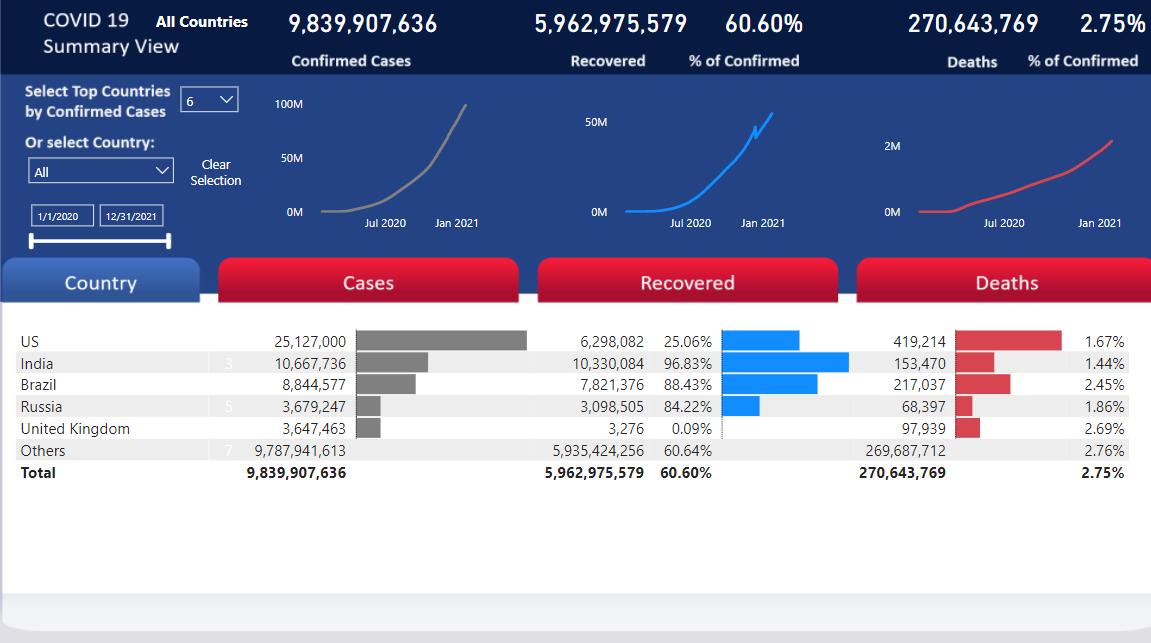
The background for the page I used PowerPoint and saw something that @alexdupler showcased on twitter. Hope that helps, sorry it’s not more comprehensive.

Any questions, happy to help,

2 Likes

This post is part of the Enterprise DNA platform improvements. Through these posts, members and non-members can showcase the resources and inspirations on how they come up with their challenge submissions. We hope all members can utilize it efficiently.

@Sue,

Wonderful use of the parameterized TOP N with Others. When you have a chance, would you mind posting the text version of that code, or alternatively post it to the Community section of Analyst Hub? I (and others I’m sure) would love to be able to add that to our code libraries.

Thanks!

  • Brian
2 Likes

No problem, will add it in to the Analyst Hub :grinning:

1 Like

Hi Brian, can I add a text document to the Hub. The code consists of several measures,
Suenew 7.txt (2.9 KB)

@Sue,

Sure, although you may find that in that case it’s best to add it via Portfolio. That way, it allows you to put anything you want in the text area, and you can also add screenshots plus a link to your challenge entry.

If you look at my recent entries, I’m using this approach to manage M code, R scripts, Tabular editor scripts, etc. I’m actually working on a video about using Portfolio this way.

Thanks!

  • Brian
1 Like

That makes sense, thanks Brian

Yes really well done Sue. impressed by your innovative visualisations ands report development features.

I can see you’ve spent a little bit of time thinking about how you wanted to position certain aspects of your report. It does tell a solid story around the raw data that made available by the challenge.

I like how you kept it pretty simple here and you’ve told the consumer just what they want to know. One of the things maybe to add here that could have added some additional value, and and other submissions, is the of a map visualisation. because going to represent things across different countries that make sense to use some sort of geographical representation of those areas. Maybe something to consider when working with other data can tell a consistent story across all of the data but then enable the consumer to do a deep dive from that macroview.

Great to have you as part of the community and participating in the challenges.

Fabulous writeup. Appreciate the efforts and loved reading about how you went about this

Sam

2 Likes

Thank you for taking the time to feed back Sam, and completely agree with your comments. I wanted to keep it simple and explore the DAX behind the grouping and ranking but it doesn’t give that additional value. I listened to @alexbadiu interview re story telling which was inspiring and gives food for thought re planning and answering questions with the data. I’m thoroughly enjoying being part of the community and being challenged and stretched to achieve. It’s a good thing :grinning:

Hi Brian, I’ve tried twice to add to the portfolio but it keeps hanging on me. Will try again today. Received your sticker today, thank you.