Hi Everyone,
First of all, I know I have many questions I ask, so first of thank you for always getting back to me on here!
Really do appreciate the help more importantly the great content!
I have a question on Benchmarking. If you dont mind to shed some light on this in Power BI.
I know the below DAX functions (the format below) could benchmark against a Min and Max of lets say Sales for example. So…
Excellent Sales would be from Min XXXXX and Max XXXXX.
Good Sales would be from Mix XXXXX and Max XXXXX using similar DAX format as below.
But this way is not very dynamic because the Power BI users would need to change the Min and Max if they wanted to change sceniaro for Min or Max.
ClassifyCustomer = CALCULATE([Total Sales],
      FILTER(VALUES(Customer[Customer Names]),COUNTROWS(FILTER('Custom Groups',
       RANKX(ALL(Customer[Customer Names]),[Total Sales],,DESC)>='Custom Groups'[Min Rank]
        && RANKX(ALL(Customer[Customer Names]),[Total Sales],,DESC)<='Custom Groups'[Max Rank]))>0))
-
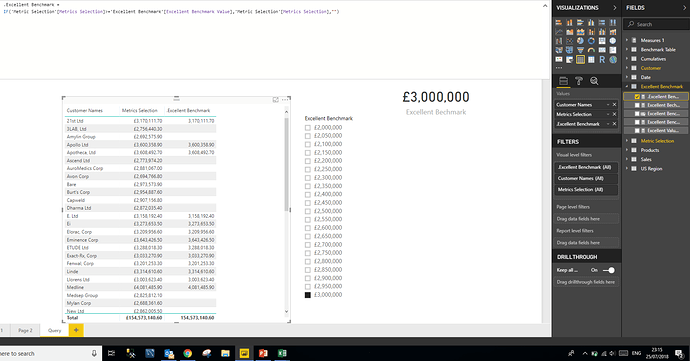
This is my query I have.
For an audience to view a report in a dynamic way how can this be done.
As you can see what I am trying to do in this report is show only Metric Selection where the value is >=Excellent Bechmark Number, and if so, it returns the Metric Selection. -
Is there a away I could potentially do this particular analysis with an IF statement. As I have come from an Excel background i prefer much more SWITCH or IF’s.
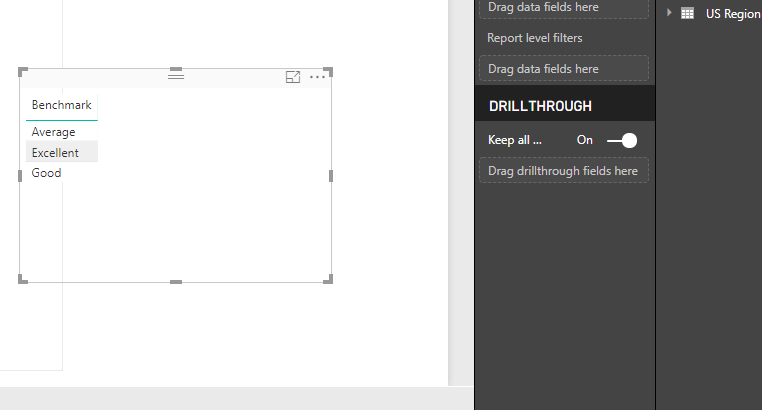
3.And after this the end goal would be to see how much value is in each bucket of Averagem Excellent, Good.
Do you see what I mean?


