Hi Forum,
I’m exploring the feasibility of creating a basic pricing tool using a Power BI dashboard.
Sales teams in my organisation work from their own excel creations where discount calculators and pricing sheets are generated manually and data is moved back and forth. Needless to say there is a lot of time wasted and errors made.
So I have been tasked with trying to come up with a consolidated pricing tool which can be represented in dashboard format and I am not quite sure if 1.) It’s even possible and 2.) if it is, what method is the best way forward.
Here are the basics:
-
All our products can be found in one static spreadsheet which is manually updated once per year by our operations and procurement departments. This process is unavoidable, but if I can reduce manual input to just this step we will have moved light years from where we currently are.
-
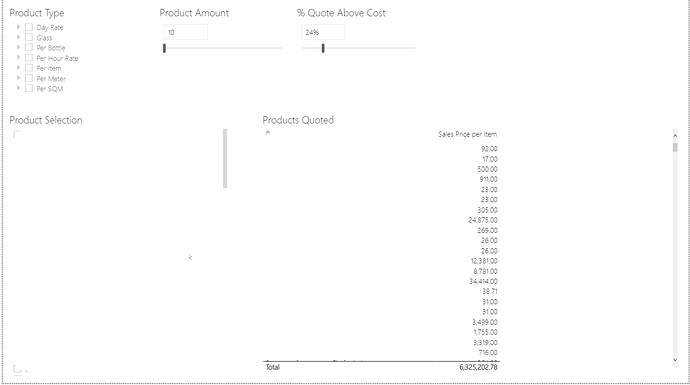
I have already played around a bit using the scenario methods learned here on E-DNA (see attached screen shot)
The challenge:
- This tool must be able to quote different amounts depending on the product type as well as represent varying percentage mark-ups/discounts for different products. For example: a customer may want to order 5 routers which we quote at 7% below list price, 7 LCDs at 13% below list price and so on.
I haven’t played around with buttons in Power BI yet, but what I require is essentially some form of “save quote to visual” function as the user goes through the list of items they want to add and use slicers to change amount and percentage accordingly. Is this possible in Power BI?
I hope the above description makes sense and thank you for any help you can provide.
