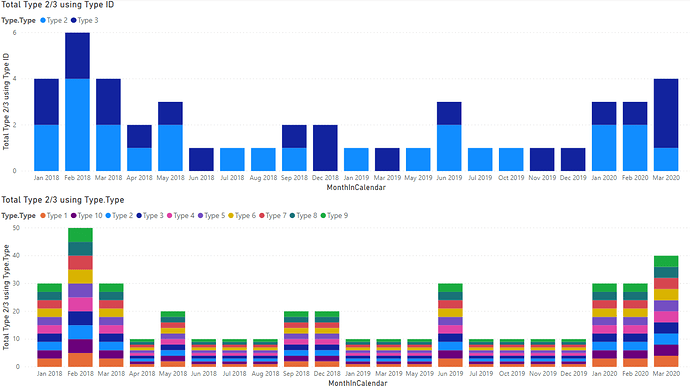
In the attached PBIX file, I have created a simplified model of the database model used by our safety incident tracking system. The data is completely made up, and the model is vastly simplified from the actual model, but I hope it will help me explain the problem I’m having.
I have created two measures to illustrate the issue:
Total Type 2/3 using Type ID =
CALCULATE ( COUNTROWS ( VALUES ( 'Incident Type'[Incident ID] ) ), 'Incident Type'[Type ID] = 2 || 'Incident Type'[Type ID] = 3 )
Total Type 2/3 using Type.Type =
CALCULATE ( COUNTROWS ( VALUES ( 'Incident Type'[Incident ID] ) ), 'Incident Type'[Type.Type] = "Type 2" || 'Incident Type'[Type.Type] = "Type 3" )
The resulting stacked column charts look like this when I use the “Type.Type” column as the legend values:
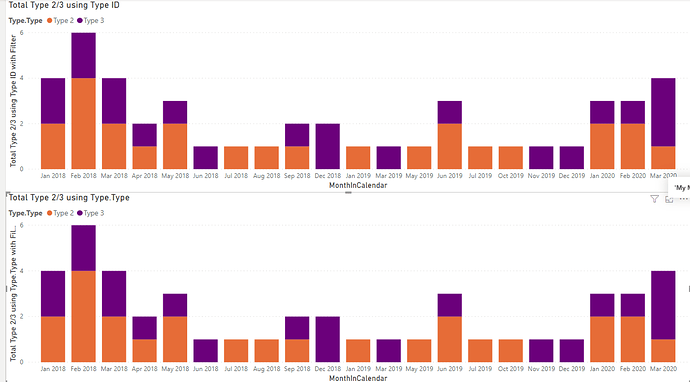
The bottom chart looks like there’s a missing or incorrect relationship in my model, but the part that has me stumped is that “Type ID” (the column used to filter the first measure), and “Type.Type” (the column used to filter the second measure) are coming from the same table. The only difference is that “Type ID” is native to the original table whereas “Type.Type” was added in PowerQuery using a merge operation with another table (you can see this transformation in the PBIX file).
Help? Why is it doing this?
Test Case 5.pbix (109.4 KB)

