Hi
I have a pie chart on the main dashboard and I would like users to be able to click on the piechart (drill through) to be able to see the make up of that selected slice as data grid in a new page (report)
can yu please point me into the right direction
Thanks
This should be very simple so I’m not sure why you can’t do this.
You’ll have to post images of how you currently doing this to see why it’s not working.
This should just work automatically in the report page.
Hi Sam,
what I’m trying to do sounds very simple however I’m stuck and would appreciate your feedback.
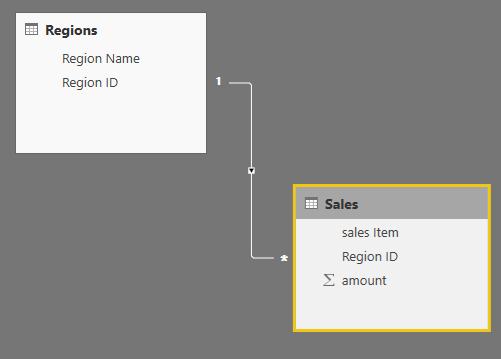
I have multiple regions and let’s say I have the sales amount per region.
I want each region when they view the report see their sales information, therefore I have added a report level filter for region. my goal is that all the information of the report will get filtered down based on the selected region on the report level.
issues:
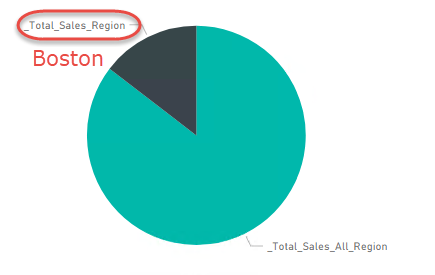
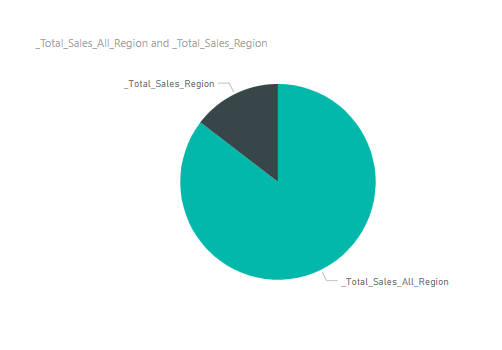
- the pie chart in the attached .pbix file will represent the total sales for the selected region against total sale.
the context is the region therefore I’m using All for calculating the total value. which works great. I want the pie chart Detail labels to reflect the select region (set on the report level ). can I use variables or expressions

- I have another page called details which gives more information about the sales
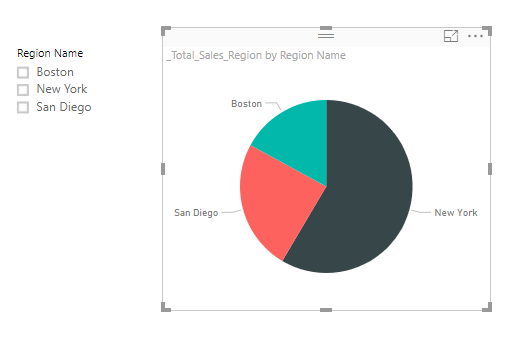
I want to be able to drill through. I have tried to add region name in the drill through section of the Details Page. however if I want to be able to drill through piechart (Dashboard page) to Detail page, I have to add Region Name to the legend of the piechart. however when I do that the piechart slices become the same colour.
what would be the right way of doing it
appreciate your advice in advance
Thanks
sample.pbix (47.9 KB)
You definitely can’t do what you need with the current setup.
You do know also that you are doubling up the amounts here. Boston is being counted twice in this pie chart. Once by itself and then once in the total

I don’t think you should be using a report level filter here. Just make it a slicer if you want to be able to select many different regions
Is there any reason why just keeping it simple doesn’t work?

You really have to have a good think about how the filters are going to work in your model here.
If you place calculations into measures they won’t do anything to the filters in you model, but if you use dimensions (or columns) from your tables they will.

Everything flows nicely when you keep it simple.
I’m really interested to understand why you can’t make it easier?
I do agree, the issue is that each region should only see the information related to their region and that’s why I’m doing this way. what would be the best way forward
Thanks in advance
Have you look into row level security at all?
I think this is your best option, and most scalable by far.
See information below


