Hi All,
I’m working on a visulisation like this:
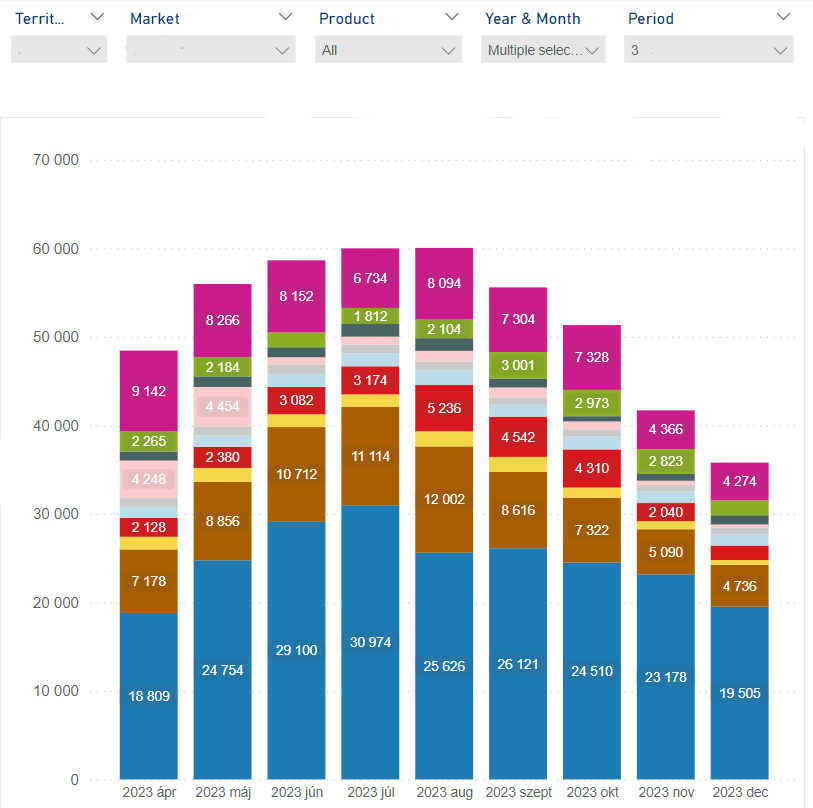
The last column in the graph above (in the current report) shows the December 2023 column for 3 months aggregated from October to December, but I would like to display only December , i.e. the last selected month and every three months (September, June…) from then onwards in the visualisation. I would like to display only the months from the last date selected in the year& month slicer backwards according to the period length, like this:
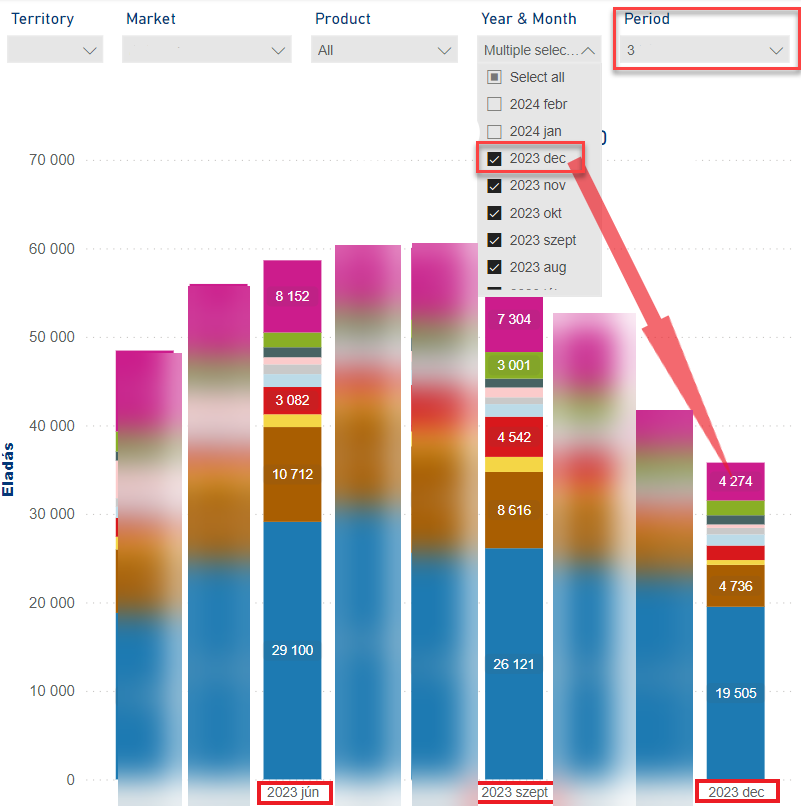
In the same way, if I filter to a 4 month period, then from the last month backwards, only display the dates every four months in the visualization. The report has a date range filter for the last 13 months on the filter pane.
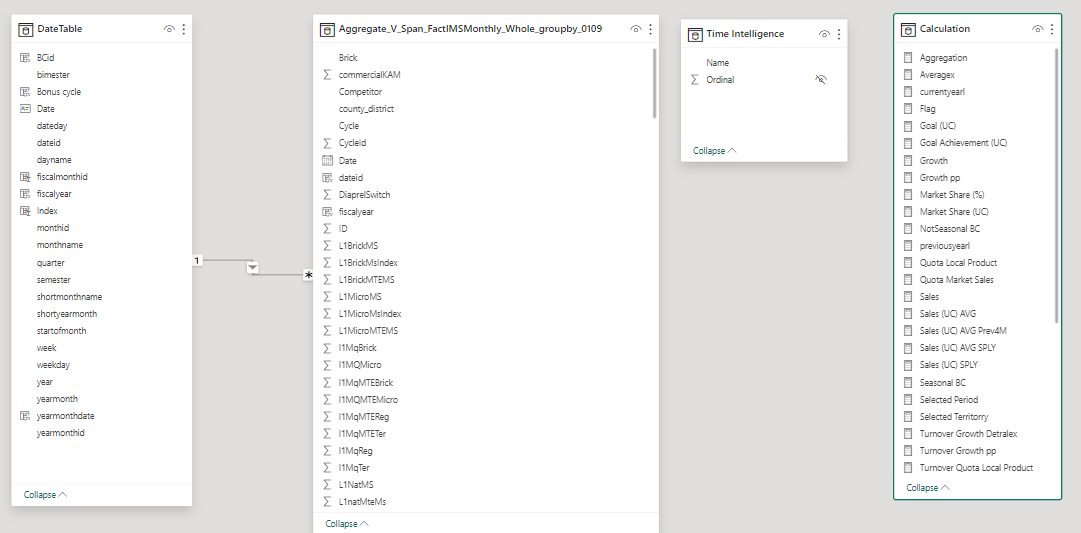
The rolling period lengths were created using time intelligence calculations. Example of period length calculation for two and three months:
CALCULATE( SELECTEDMEASURE(), DATESINPERIOD(‘DateTable’[Date], LASTNONBLANK(‘DateTable’[Date], SELECTEDMEASURE()), -2, MONTH) )
CALCULATE( SELECTEDMEASURE(), DATESINPERIOD(‘DateTable’[Date], LASTNONBLANK(‘DateTable’[Date], SELECTEDMEASURE()), -3, MONTH) )
I have a fact table and a date dimension table like this:
Any help would be greatly appreciated and I look forward to your feedback as soon as possible.
Kind regards