Hey All
Pls i need assistance in creating a visual that tracks changes made on different dashboards.
I have an idea of what i want but cant really put it together now.
I have attached the excel file source and my visual idea. to this.
Pls i will appreciate any help from the team to put this together (18.3 KB)
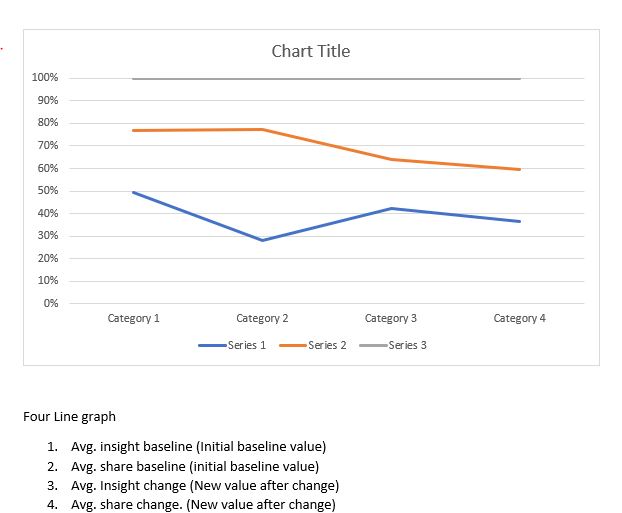
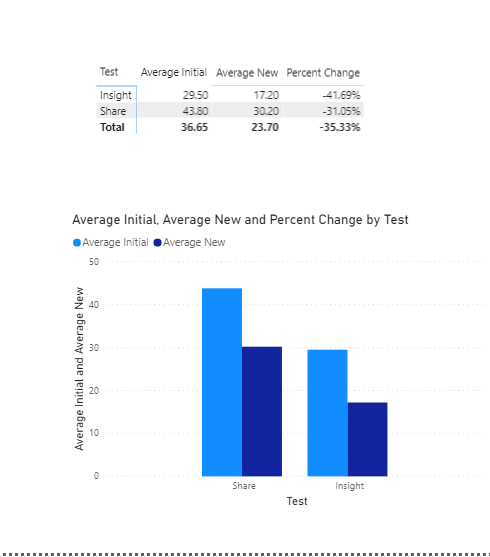
I’m probably not understanding the question correctly, but your mockup result doesn’t make sense to me in light of the data provided. If I understand correctly, the categories in your visual above represent your four measures. If that’s the case, then a line chart is not appropriate, since it implies a series of changes over time to the same variable. Instead, what you have are comparisons within and across categorical variables (share vs. insight). For that scenario, a clustered column chart makes far more sense to me than a line chart. See what you think:
Hey @BrianJ
Thanks so much, i was open to any type of visual that will bring out the idea.
The purpose of the Excel tracker was to see how fast the PBI report load between share and insight test. After some visuals and textboxes were removed from the reports(PBI Pages) another test was conducted to capture load time improvement on both site(share & insight) Some of the pbi pages in the excel sheet Aare yet to be populated but i hope this explains it enough for you?
Thanks so much i think you have given me a lead now, all i need to do is add a slicer for the PBI pages used in the report.
I appreciate this @BrianJ Pls let me know if there are other measures i can highlight .