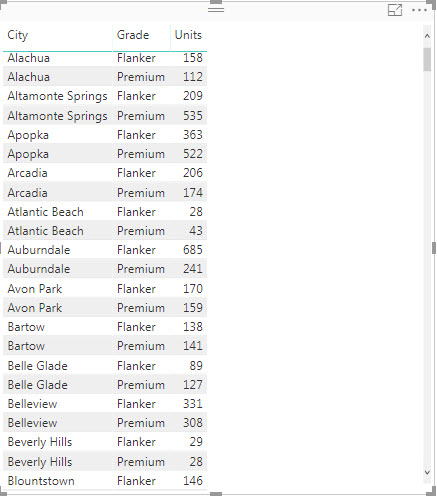
I have a visualization with 3 columns, City, Grade and Units. I would like to calculate the percentage of the Grade for each city and I am having trouble getting a calculated measure to give me the results, i.e.; for the first City Alachua Flanker would be 58.52% and the Premium would be 41.48%
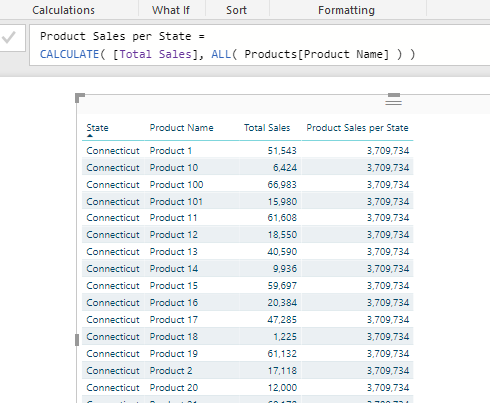
I want to get to a lower level of detail. This calculation gives the total sales for the state for each product. I am looking for a way to calculate the percentage of sales for each Product Grade by City. The business requirement is: What is the percentage of sales for premium products in each city in Florida. In my table that I sent in the first image the % sales for premium products in Alachua is 41.48%. I would like a visualization that gives me this calculation for all cities within the selected State
I have been able to get this calculation to work and it was triggered by 2 things you have said, putting the calculation into the correct context and another video where you were explaining the sumx function. I wanted to calulate the sales of a product type by city and it was the sum by city that was my stumbling block. This calculation gives me the result I am looking for:
My Premium Mix % by City =
DIVIDE(
CALCULATE( [Sales Qty], Products[Product Grade]=“Premium”)
, sumx( values(Geography[CITY]), [Sales Qty])
)
I have spoken too soon. When I add a sli cer to the page, the value of the denominator is affected. How can I get the sumx expression to ignore the filtering that the slicer imposes on the list
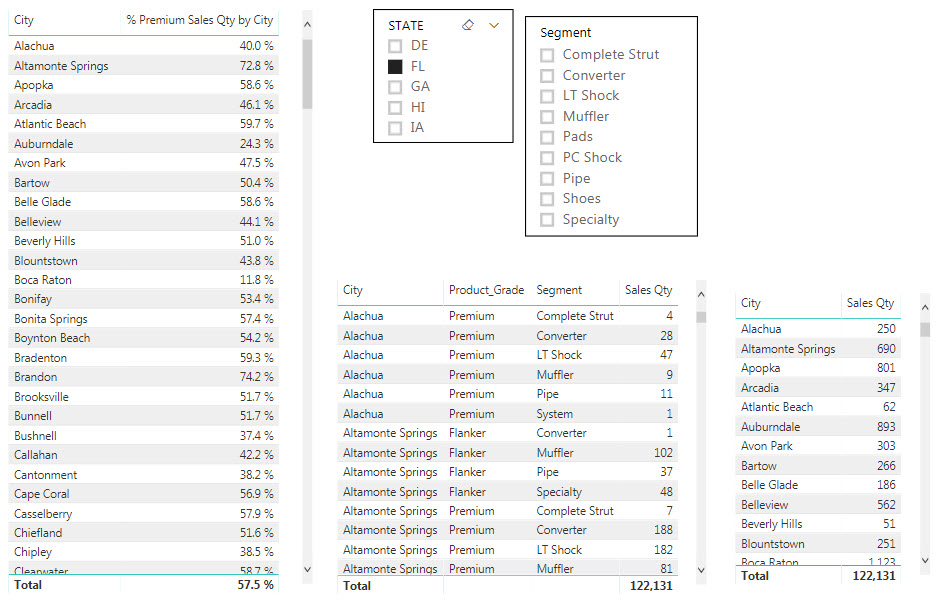
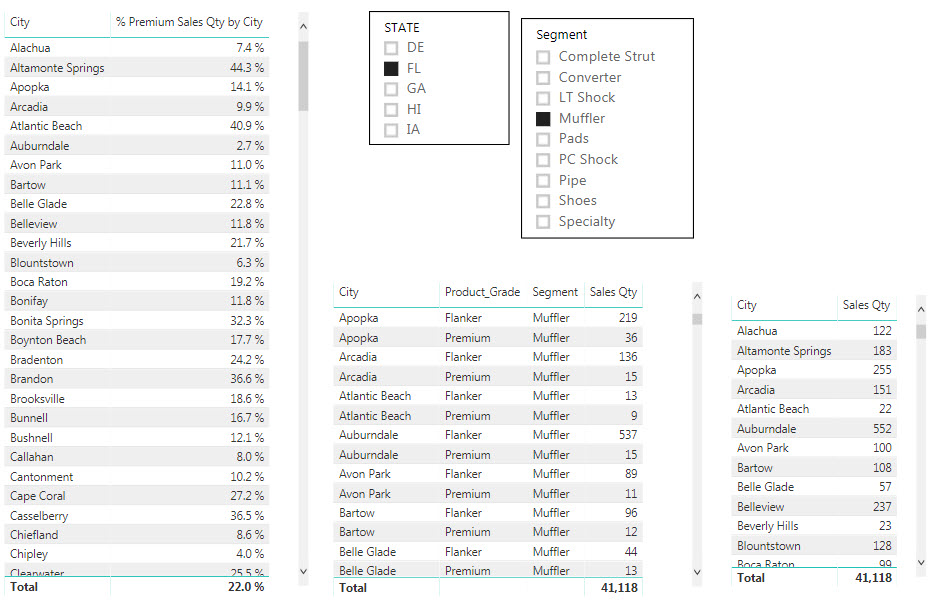
Table on Left displays the cities and the % that I am looking for
Table on the bottom in the middle displays the qty for each segment to indicate that ther are Premium and Flanker qty’s
Table on the bottom ot the right displays the total qty for each City ( the denominator that I want to remain constant regardless of what the slicers do
When I select a segment, you can see that the total qty for each city has changed. This is what is happening with the denominator in my measure and this is what I am trying to resolve
% Premium Sales Qty by City =
   DIVIDE(
          CALCULATE( [Sales Qty], Products[Product_Grade]="Premium")
           , **sumx( values(Geography[City]), [Sales Qty])**
           )
You should be able to adjust this with a formula similar to this as if you want to make sure the denominator doesn’t change wrap ALL() around that column.
Like so
% Premium Sales Qty by City =
DIVIDE(
CALCULATE( [Sales Qty], Products[Product_Grade]=“Premium”)
, CALCULATE( [Sales Qty], **ALL( SegmentColumn )**)
)
I think this should do it base on the logic you are specifying.
I’ll walk through it to make sure.
With this calc you are reviewing the % of premium products sold based for the selected context versus all products sold in that city (regardless if they are premium or not, or whichever segment they are)
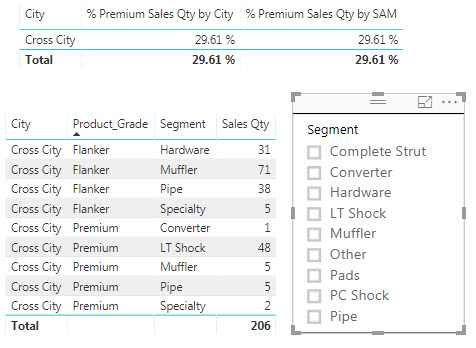
Here is an image that displays the details for 1 city in the state. The column on the far right, at the top is your new measure. The table shows 48 premier LT Shocks out of a total of 206 which should be 23.3 %
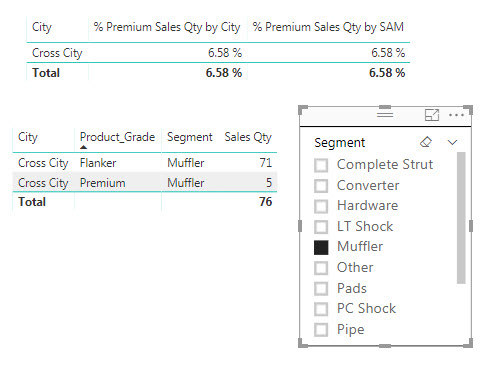
This image shows the result when I select the single segment. And this result is displaying the percentage of the segment selected, dividing 5 by 76, not by the total sales in the city of 206. The correct result should be 2.43%