Hi,
I have tried:
Rank Sales QTYs =
IF (
ISINSCOPE ( SummarizeTab[Product Name] ),
RANKX (
    ALLEXCEPT (
        SummarizeTab,
        SummarizeTab[Product Name]
    ),
    SUMX(SummarizeTab, SummarizeTab[Sales QTYs] )
  ),
 IF (
    ISINSCOPE ( SummarizeTab[Customer Area] ),
    RANKX (
        ALLSELECTED ( SummarizeTab[Customer Area] ),
        SUMX(SummarizeTab, SummarizeTab[Sales QTYs] )
     )
  )
)
I also tried SUMMARIZECOLUMNS to bring in the columns from various tables, sorting it by region and by sales before finding the percentage contribution but that did not work
 SummarizeTab =
     SUMMARIZECOLUMNS(
      Customers[Customer Area],
      Products[Product Name],
      "Sales QTYs", [Transaction] )
I do honestly need your help.https://1drv.ms/u/s!Aj8eUM9XW8iTgddz-WpFw7RFTWhfKA?e=DzCXcX
Product Sales and Perc Contribution.pbix (284.3 KB)
diego
July 4, 2020, 2:48pm
2
Hi @upwardD
Thanks for sharing, your posts are really interesting to learn
Attached the solution.
Your summarized table does not work because is isolated, so I used the model tables.
It was missing a CALCULATE to compute the ranking,
I hope it helps,
Diego
Product Sales and Perc Contribution Diego.pbix (284.1 KB)
Hi,
Top Products Per Region =

IF (
ISINSCOPE ( Products[Product Name] ),
RANKX (
    CALCULATETABLE (
        VALUES ( Products[Product Name] ),
        ALLSELECTED ( Products[Product Name] )
    ),
    [Sales Quantity]
),
IF (
    ISINSCOPE ( Customers[Customer Area] ),
    VAR AreaSales = [Sales Quantity]
    RETURN
        CALCULATE (
            RANKX (
                VALUES ( 'Customers'[Customer Area] ),
                [Sales Quantity],
                AreaSales
            ),
            ALLSELECTED ()
        )
)
)
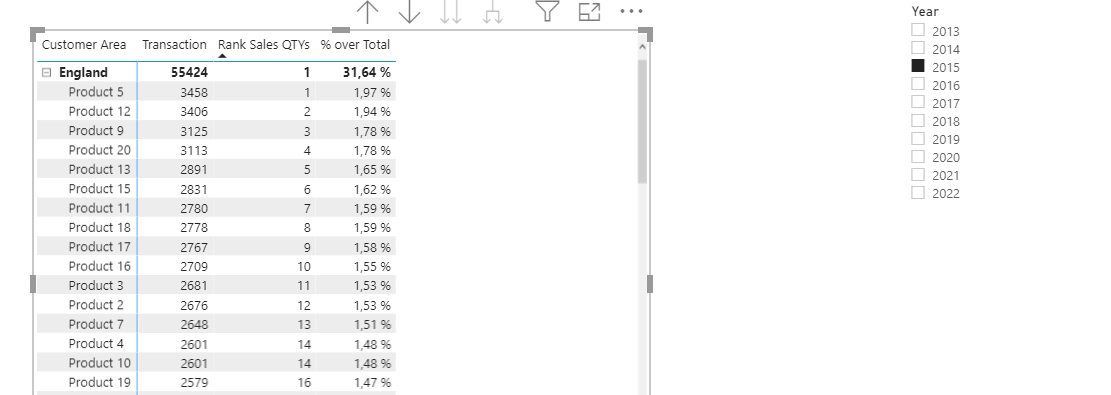
I want to be able to display a report which shows the product that had the most Sales Quantity per Customer Area and it’s percentage contribution to total sales products, slicing data by year
.pbix file
I anticipate your help.Product Sales and Perc Contribution.pbix (283.6 KB)
diego
July 4, 2020, 2:50pm
4
@upwardD
diego
July 4, 2020, 3:03pm
5
The final code for the ranking, I just changed All(Products) by ALLSELECTED(Products)
Rank Sales QTYs =
IF (
    ISINSCOPE ( Products[Product Name] ),
    RANKX (
        ALLSELECTED ( Products ),
        CALCULATE ( SUMX ( Orders, Orders[Sales Quantity] ) )
    ),
    IF (
        ISINSCOPE ( Customers[Customer Area] ),
        RANKX (
            ALLSELECTED ( Customers[Customer Area] ),
            CALCULATE ( SUMX ( Orders, Orders[Sales Quantity] ) )
        )
    )
)
Hi diego,
Great solution.
diego
July 4, 2020, 3:17pm
8
Glad to hear! I appreciate if you can check the problem as solved.