So I was trying to look through the training courses to see if I could find a video that deals with Percent Change between years and comparing a month to that same month last year. I couldn’t find anything but I am certain I am just overlooking it. Thoughts?
I have my registrations connected to a Dates table. So I want to be able to see the percent change from 2016 to 2017. I want to be able to get granular and say what is the percent change of January 2016 as it relates to January 2017. So not comparing the percent change from January to February but truly against the same month historically. I have 5 years of data in my Registration table.
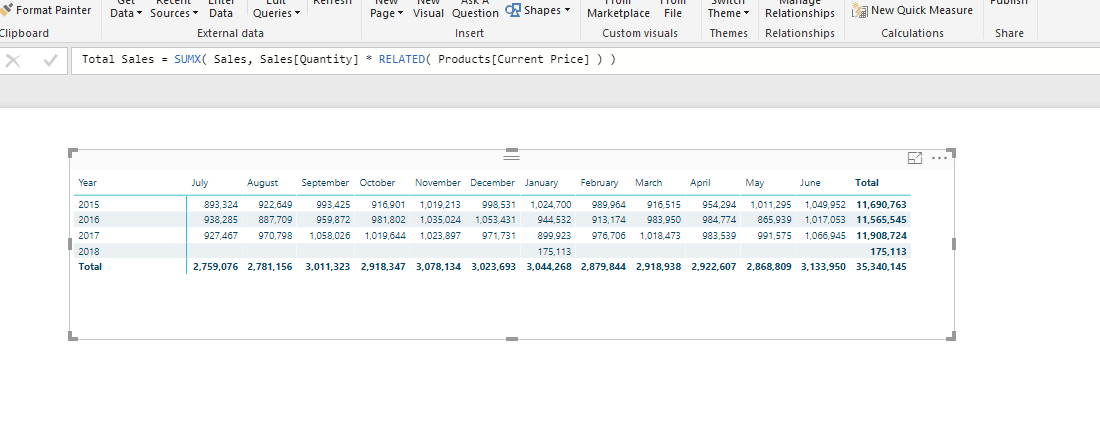
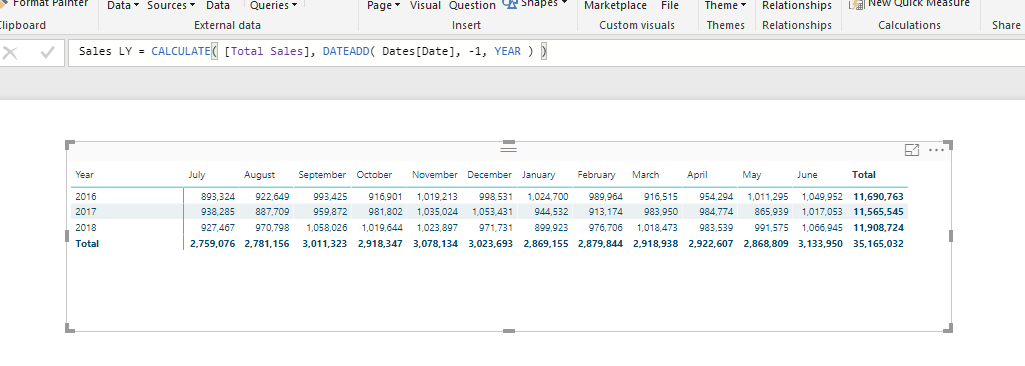
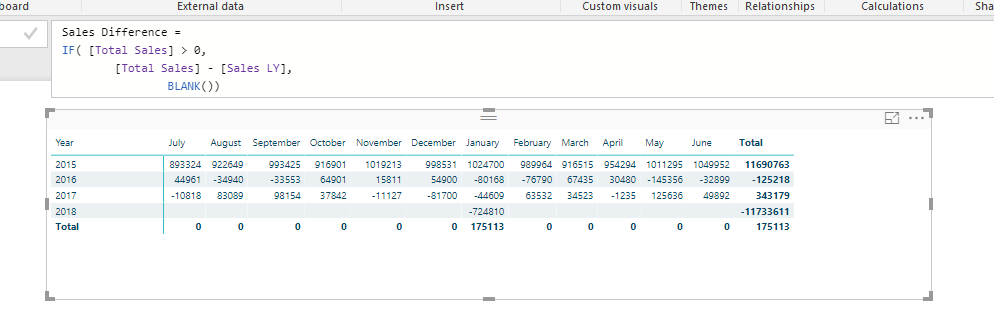
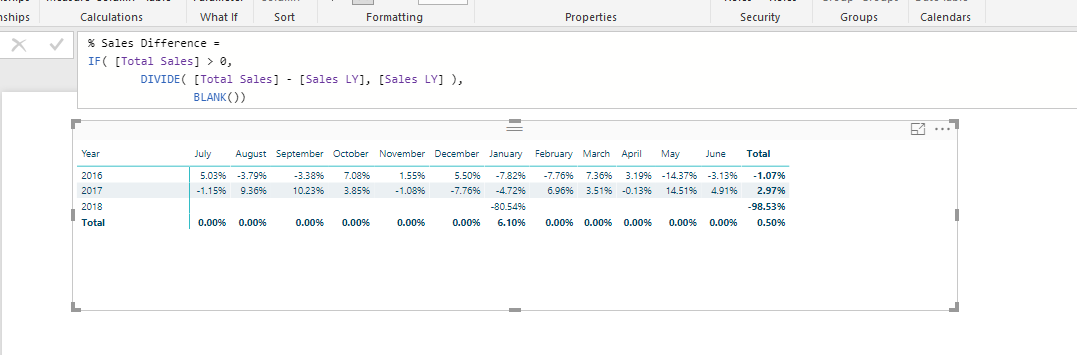
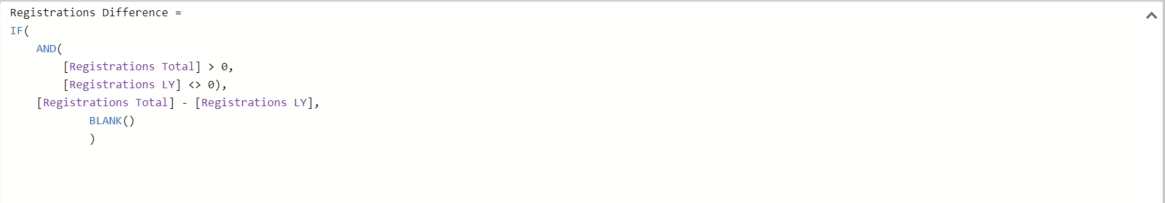
So I was able to follow the video and constructed the Previous AY and then Difference between Current and Previous AY.
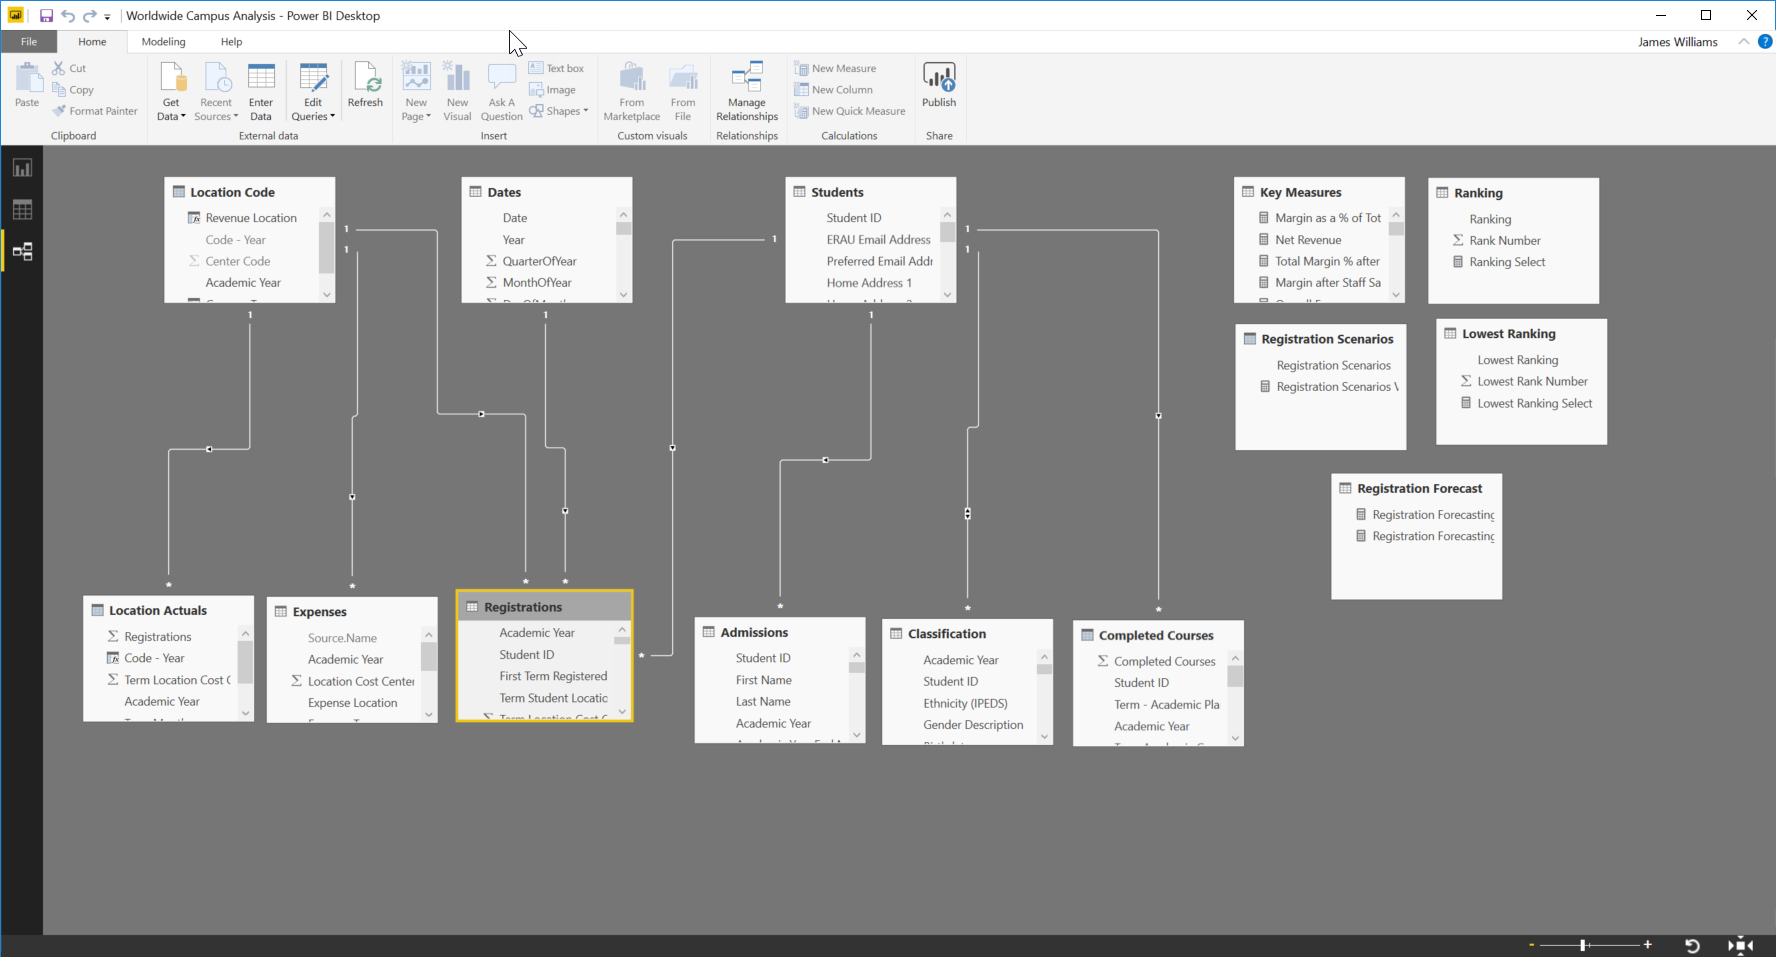
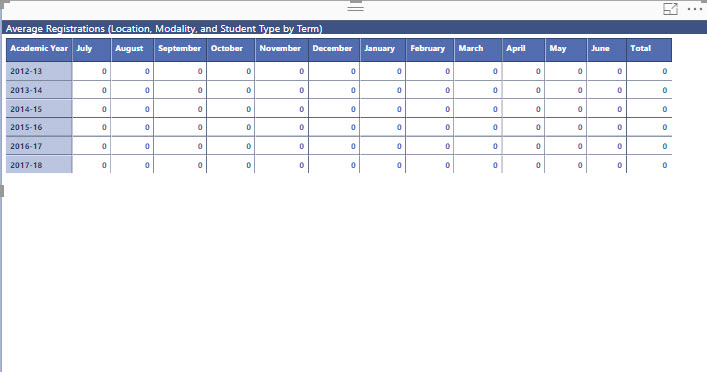
What I want to be able to do is look at the difference across Campus Location not just the date itself. Adding the Location name makes Previous AY and Difference between Current and Previous AY go to being empty. The Location Table is joined to the Registration Table.
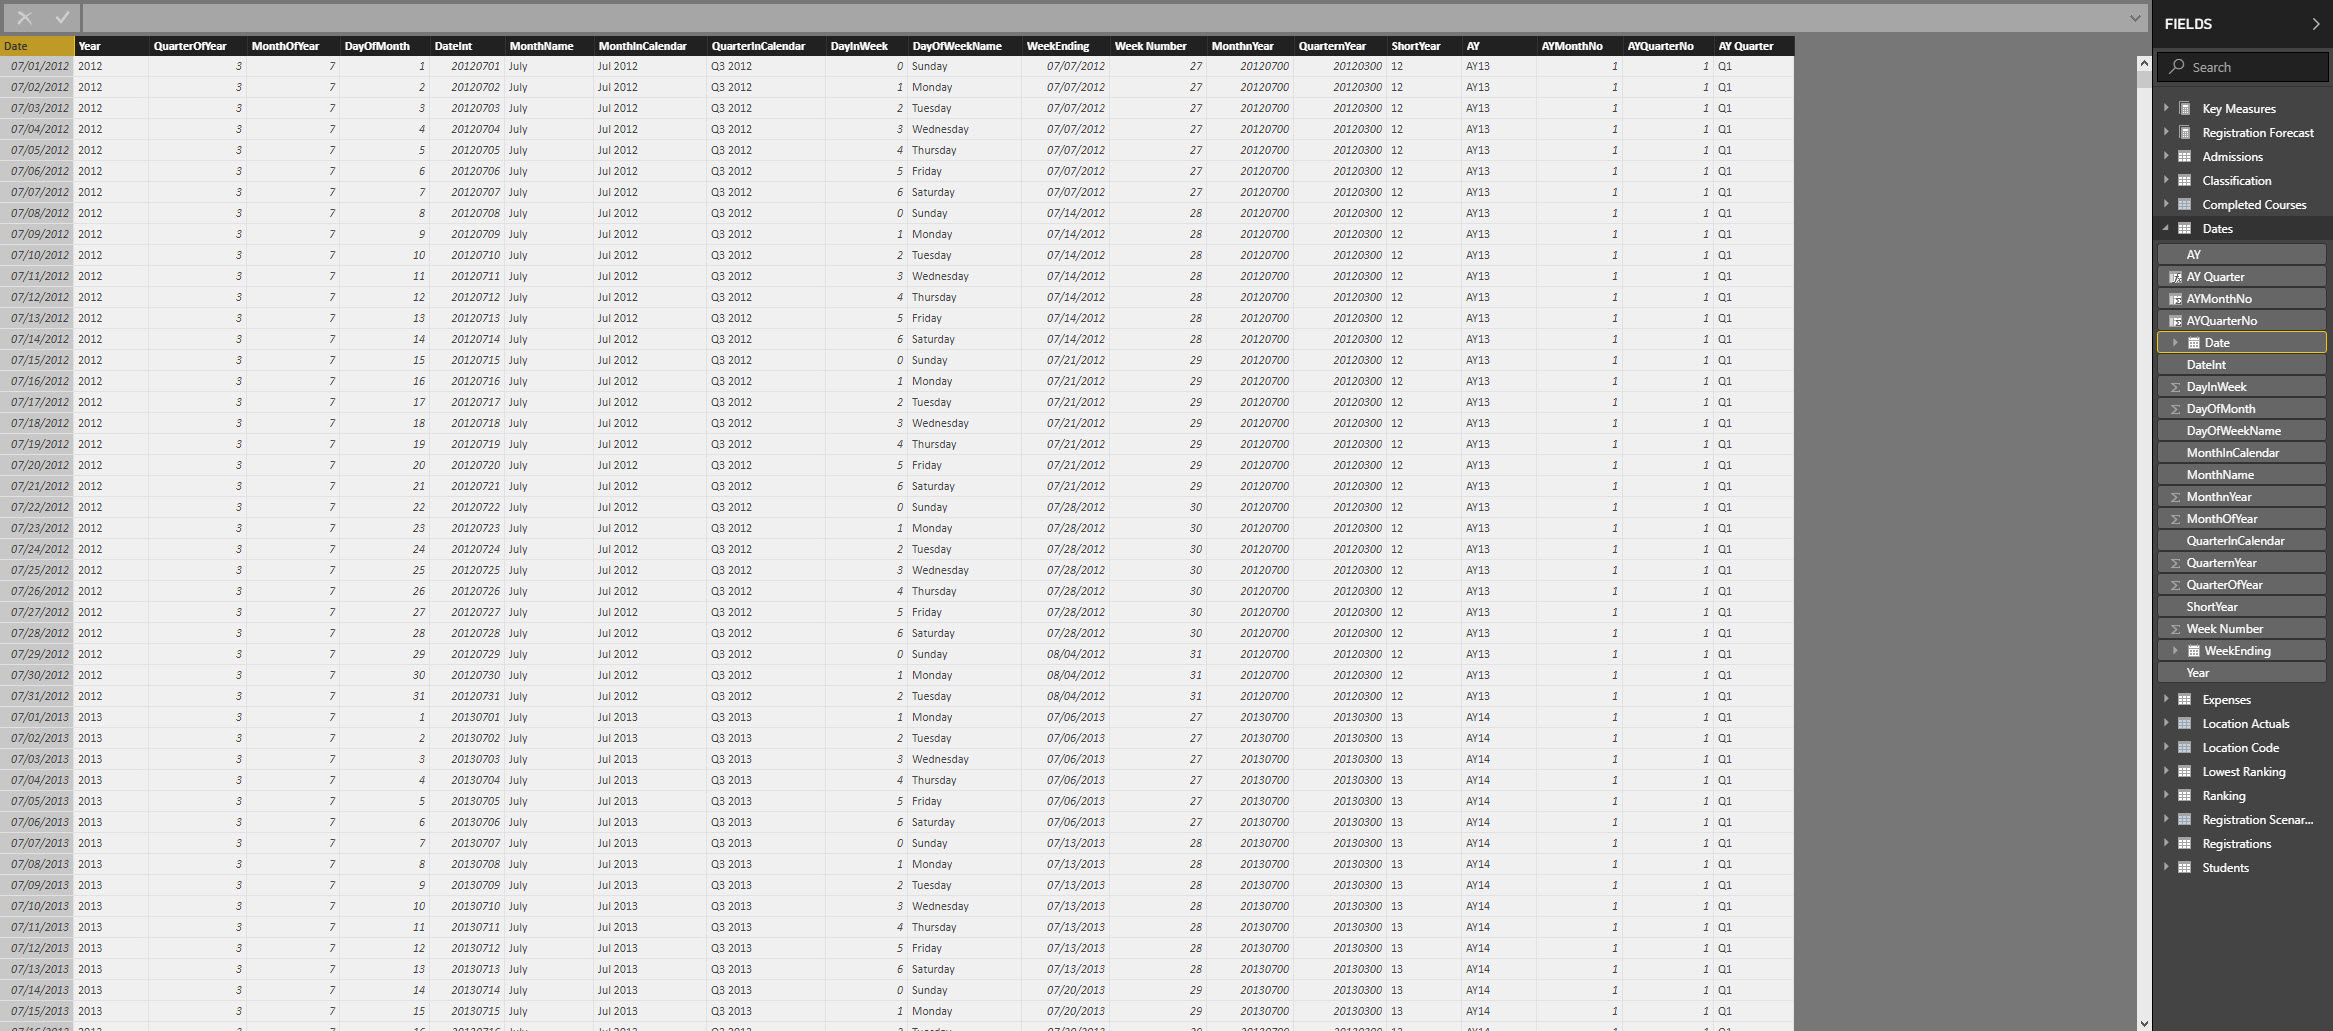
View of my Key Measures Table, Dates Table, and Registrations Table (at least the important values). AY was used in place of Year since we speak in terms of Academic Years which begins July 1 of a year and ends on June 30 of the following year.
Because each row in the registrations table is a registration. What makes the difference in terms of years is the term start date which is connected to the Dates[Date] field.
The rate of total cost of the registration is a column within the registration row because no registration costs the same. But is it even necessary for me to have this?
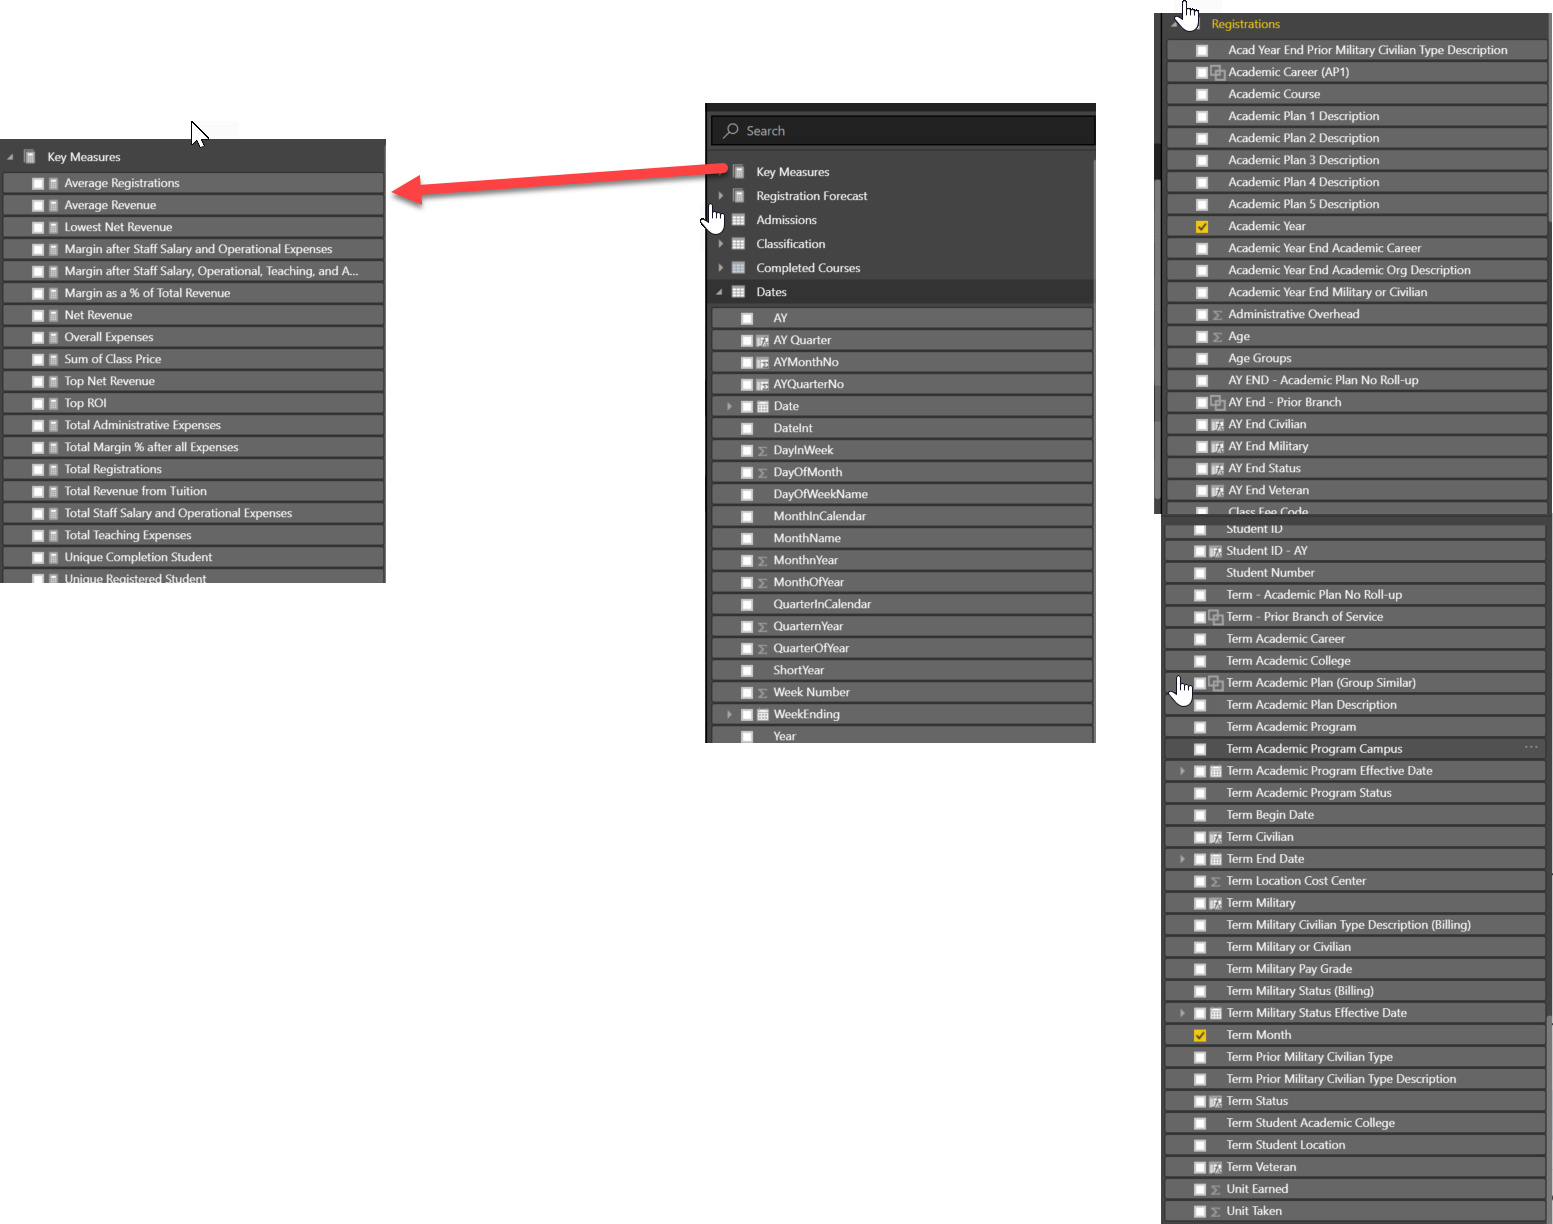
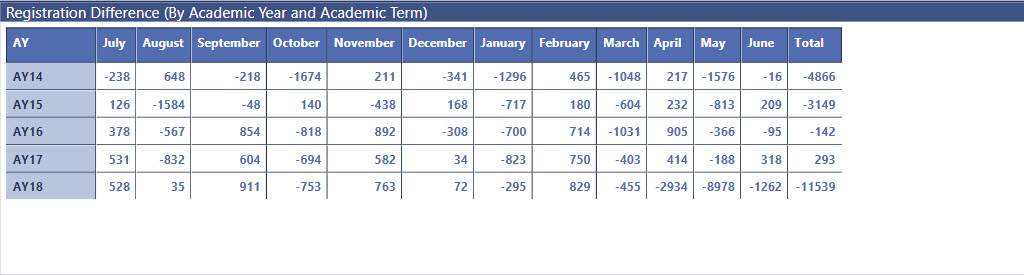
Ahhh I see. I actually have them already in the ‘Dates’ table. I was just using the Academic year from the ‘Registrations’ table in the visual. Switching to using “AY” and “MonthName” from the ‘Dates’ table fixed the issue with the zeros appearing.
Then sine AY13 was the first year in the table and it only showed the values for that year since there was no previous year in the data, I just did a right-click and exclude AY13 to make it disappear. Not certain if thats the best approach to do that or if there is a more appropriate approach to hiding the first year in the visual.
The below worked. I no longer have to manually exclude the very first year. Now what I have noticed and see Microsoft hasnt responded to the threat from others posting is that the published report gives a “Resource Limit Reached” message so it doesnt render the visual (see http://community.powerbi.com/t5/Service/visual-has-exceeded-available-resources/m-p/356781#M39873). It renders in the Power BI Desktop Client just not in the published web report.
Have you ever come across this issue? I am a pro and premium Power BI user so I can at least open a ticket with them without paying for it but given others didn’t seem to get a response it doesnt sound promising.