Pareto / TOPN/ Tree Map issue

Hello @Harsh ,

I hope you had a great weekend.

I watched both Summits and read the article.

I agree that DAX is simple but not easy. With DAX you need to understand how each function will behave it’s not like excel where you can dive into the formula bar and read each step by step.

I think slowly I start to understand how the advanced RANKX formula works, as I understood the formula is summing up so we need to be careful if there are any duplicate names.

I am attaching the file that I work with. Pareto.pbix (122.9 KB)

There are few customers that have the same name but unique customer ID.

I have used different contexts to ensure I will get the correct answer.

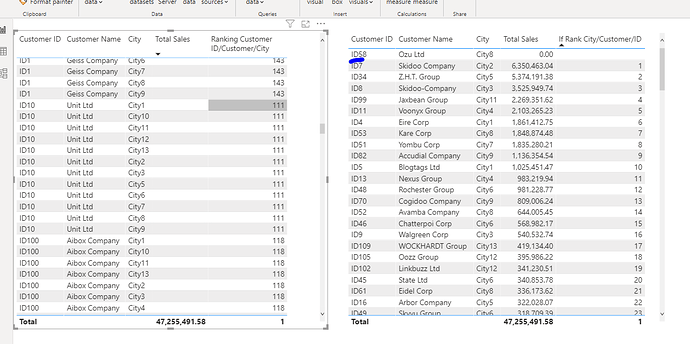
Page 1 I Ranked by Customer and By Customer ID to display customerID and customer names, I add ALLSelected so it’s applying extra context.

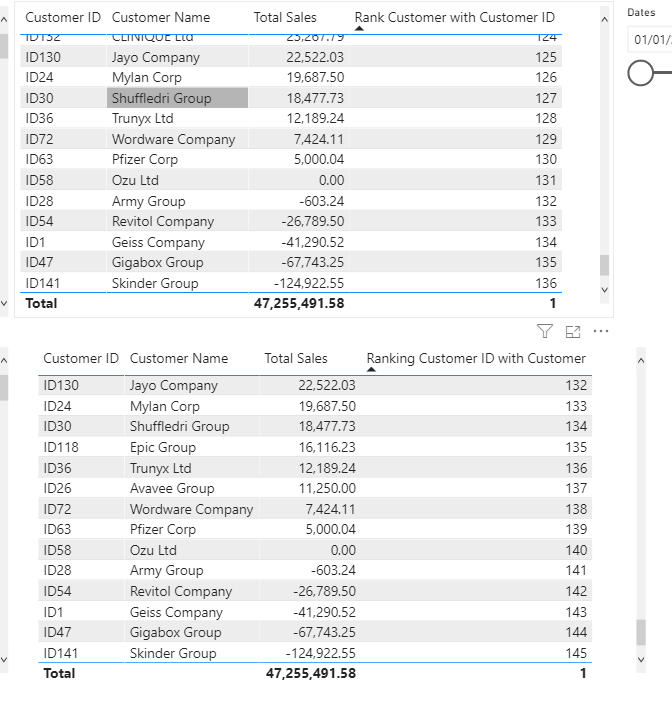
On-Page 2 I add another context City, but then while I review the data, the rankx worked nearly correct, the data was kind of duplicating creating extra customer names for each City. I believe I could merge all 3 and then Rank them by unique name then the formula would work as I assume.

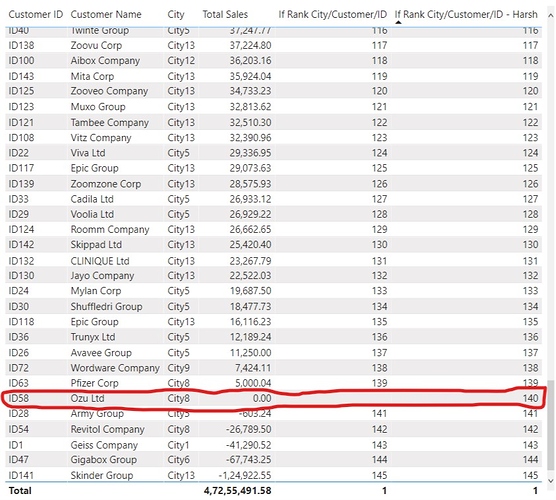
I used If statement to rank everything in order but I run into a small issue

If Rank City/Customer/ID = IF([Total Sales] = 0,BLANK(),CALCULATE( RANKX(ALL(Customer[Customer ID]), [Total Sales],DESC),
ALLSELECTED(City[City]),
ALLSELECTED(Customer[Customer Name])))

Is it possible to adjust the if statement to put 0 value in rank order? Or I should actually for this task merge 3 columns in the sales table since City and Customer are in two different tables?

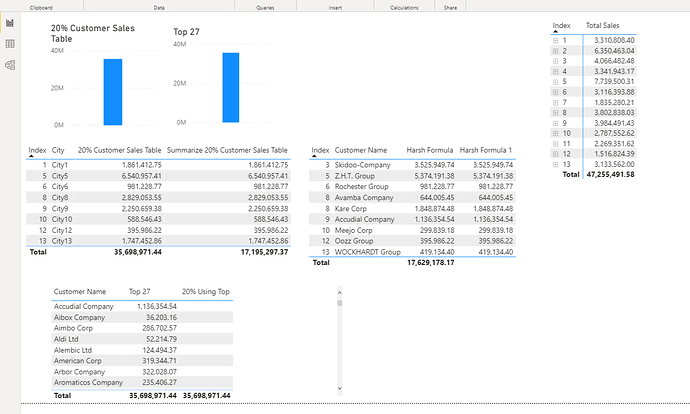
On page 3 I tried to calculate 20% of RANKX

To ensure it works correctly, I applied the TOPN formula if you notice both Column Charts are correct.

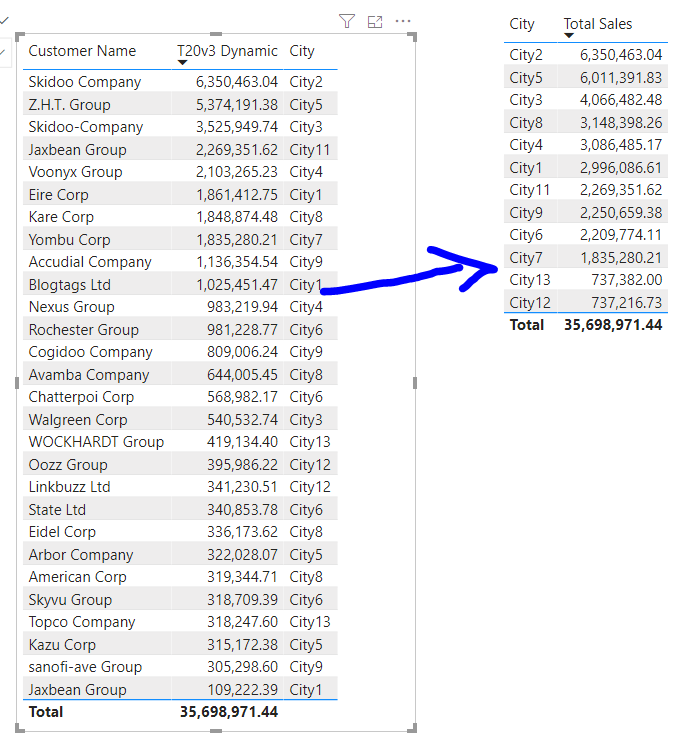
But when we apply customer name or city context to the table I don’t believe the formula works correctly. As I do know in City 2 (see matrix table) there are sales over 6.5 and there is one customer only.

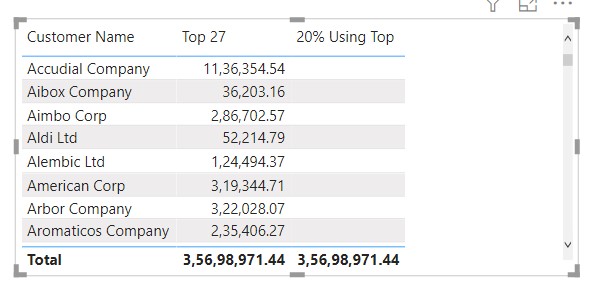
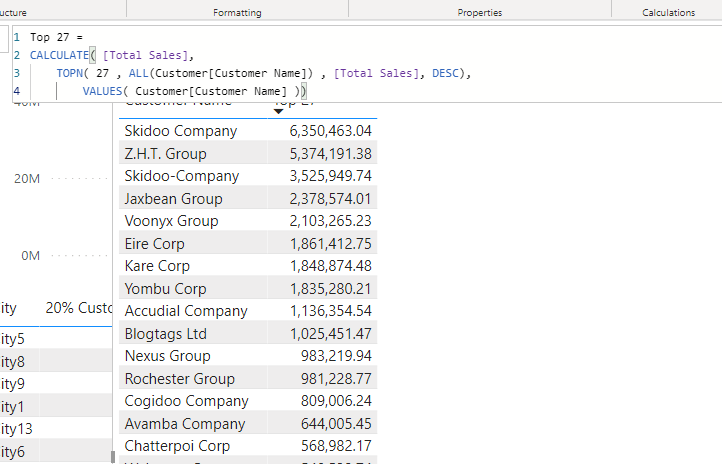
To see my TOP20% customer, I just used TOPN formula (see TOP27)
I thought I can apply Variable function to my top20% but I just received a correct total amount but when the customer names context is applied there rows are empty. I tried to apply your Formula “ISfiltered” but didn’t work.

I divided your formula into two sections to have a better understanding and this is how I understand:

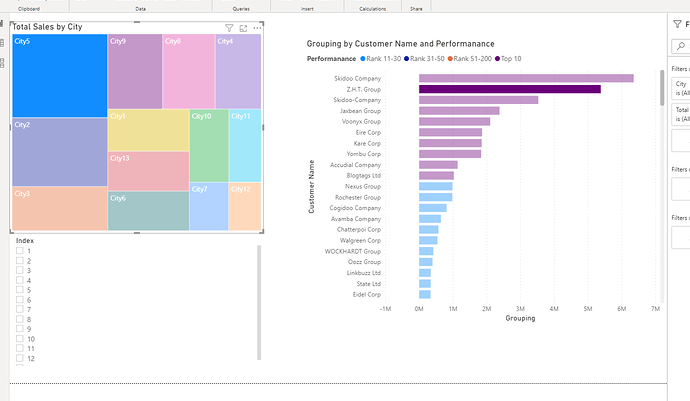
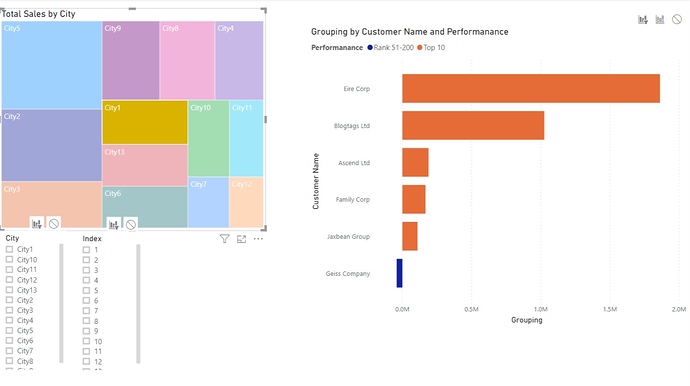
At Page 4 I played with grouping measures

If I apply the filter for the city then I get all customer names grouped correctly but if apply the filter from treemap only one customer is visible.

Should I turn off the interactions between grouping and treemap or the formula needs to be adjusted?
As I understand treemaps are good for showing the proportions between each part and the whole, display large numbers shows patterns, outliers.

I will appreciate your help.
Hello @Matty,

Thank You for posting your the query onto the new thread.

I’m glad you’ve tried different variations of the formula to analyze the different scenarios. :slightly_smiling_face:

Now, I would like to jump to the analysis “Page-by-Page”.

So as per my understanding “Page 1”, looks goods to go.

Page 2: Part 1

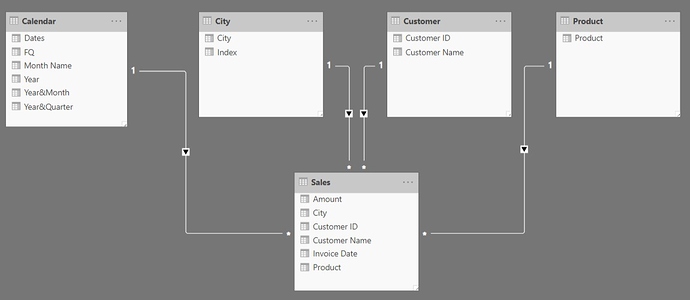
When I referred the 1st Table visual it shows it as blank because there’s no direct relationship between Customers Table and City Table so it’s a kind of Cross Join that you’d created in your formula without adding the context in it. In your table, the relationship diagram is as per the screenshot provided below -

Now, your Customer ID field from Customer Table and City field from City Table flows down to the Sales Fact Table. It means that your Customer Name flows down to the Sales Table but then cannot move up towards the City Table due to the Waterfall Effect created by using "One-to-Many" Relationships.

Page 2 : Part 2

When I refered 2nd Table visual in that the DAX is working correctly because the condition is applied as “Total Sales = 0” so it’s calculating the Rank where “Total Sales > 0” and “Total Sales < 0” but not when it’s equal to zero. So the formula which you’d written is a follows -

If Rank City/Customer/ID = 
IF( [Total Sales] = 0 ,
    BLANK() ,
       CALCULATE( 
          RANKX( ALL( Customer[Customer ID] ) , [Total Sales] , , DESC) ,
             ALLSELECTED( City[City] ) ,
                ALLSELECTED( Customer[Customer Name] ) ) )

I’ve made the slightest change in your formula and the new formula is as follows -

If Rank City/Customer/ID - Harsh = 
IF( ISBLANK( [Total Sales] ),
BLANK() ,
    CALCULATE( 
        RANKX( ALL( Customer[Customer ID] ) , [Total Sales] , , DESC) ,
            ALLSELECTED( City[City] ) ,
                ALLSELECTED( Customer[Customer Name] ) ) )

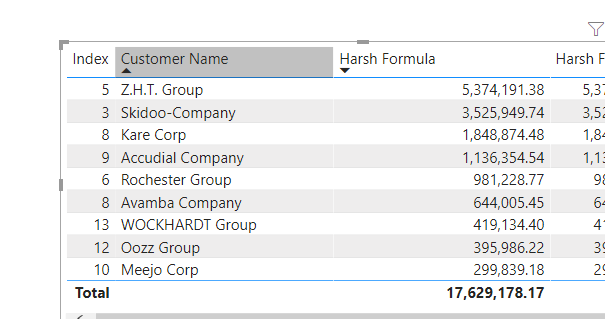
After modifying the formula the result look as per the screenshot provided below -

Moving on to the -

Page 3 : Part 1

You wanted to calculate the “20% Using TOPN” and the formula you calculated is provided as below -

20% Using Top = 
VAR Top20 = DISTINCTCOUNT( Sales[Customer Name] ) * 0.2

RETURN
CALCULATE( [Total Sales] , 
   TOPN( Top20 , ALL( Sales[Customer Name] ) , [Total Sales] , DESC) ,
      VALUES( Sales[Customer Name] ) )

Now, if you observe you’ve just considered “DISTINCTCOUNT(Sales[Customer Name])” without adding back the context from the Sales Table and that’s the reason why it showed the Blank values. Below is the screenshot provided for the reference -

Pareto Analysis - 3

Page 3 : Part 2

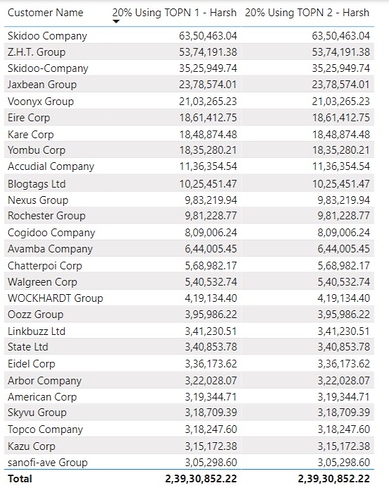
Now, I’m providing my formula below for the reference where first it calculates the Unique Customers and then that is referenced as Top 20 within the Variables -

20% Using TOPN 1 - Harsh = 
VAR UniqueCustomers = CALCULATE( DISTINCTCOUNT( Sales[Customer Name] ) , ALL( Sales ) )
VAR Top20 = UniqueCustomers * 0.2

RETURN
IF( ISFILTERED( Customer[Customer Name] ) , 
    IF( [Customer Ranking] < Top20 , [Total Sales] , BLANK() ) , 
        CALCULATE( [Total Sales] , TOPN( Top20 , ALL( Sales ) , [Total Sales] , DESC ) ) )

Alternatively, instead of using 2 variables you can also combine it under one variable as provided below -

20% Using TOPN 2 - Harsh = 
VAR Top20 = CALCULATE( DISTINCTCOUNT( Sales[Customer Name] ) , ALL( Sales ) ) * 0.2

Return
IF( ISFILTERED( Customer[Customer Name] ) , 
    IF( [Customer Ranking] < Top20 , [Total Sales] , BLANK() ) , 
        CALCULATE( [Total Sales] , TOPN( Top20 , ALL( Sales ) , [Total Sales] , DESC ) ) )

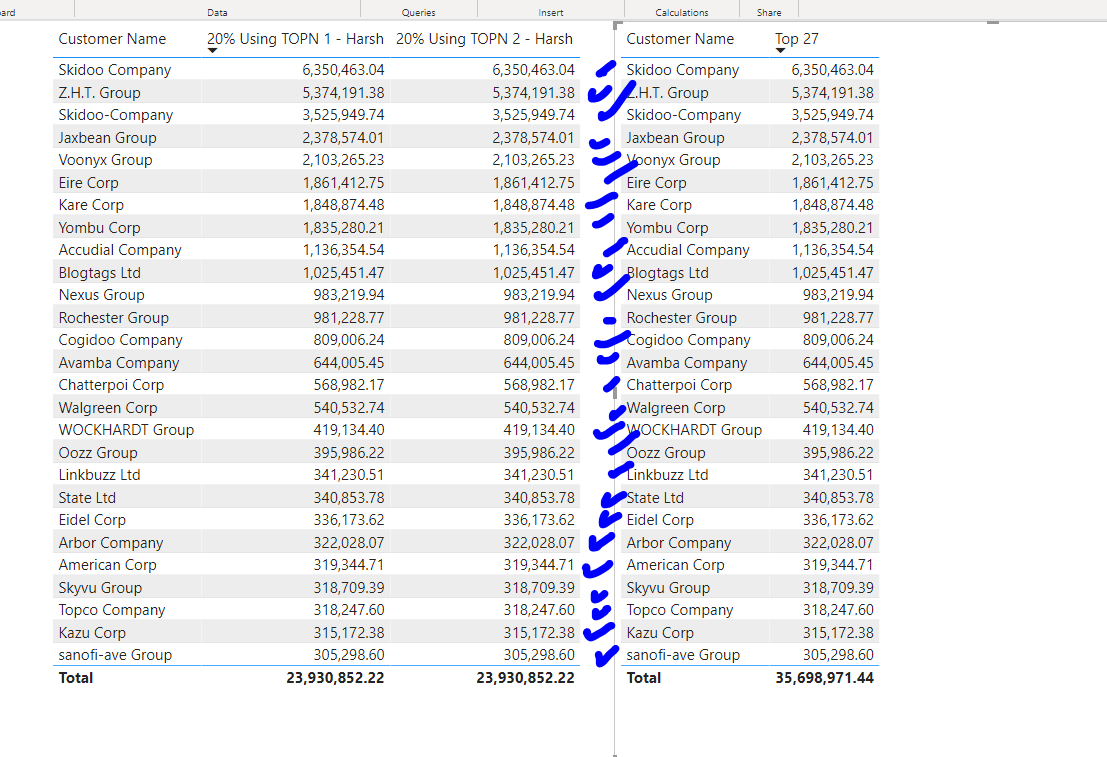
After calculating the above formulas the result will be as provided in the screenshot below -

Page 4:

It’s just a matter of choice. If you select any tile from the Treemap it will show you only partially filtered bar graph but when you select the filter it shows you all the Customer Name in the Bar Chart by applying full filters. Now, if you use “Edit Interactions” options you’ll have the same effect as good as you’ve clicked on a filter.

Below is the screenshot provided for the reference.

I’m also providing a working of my PBIX file for the reference.

Hoping you find this useful and helps you in your analysis. :slightly_smiling_face:

Thanks & Warm Regards,
Harsh

Pareto.pbix (112.0 KB)

Thank you @Harsh

I feel like I am back in school in good meaning :slight_smile: Where I can learn from experts and together we can go through the simple or advance stuff.
Would you recommend any book to read about Power BI ? Currently I started reading “M for data monkey”
With Power BI its all about practicing its like cooking, you can read the book but still you wont be a chef :).

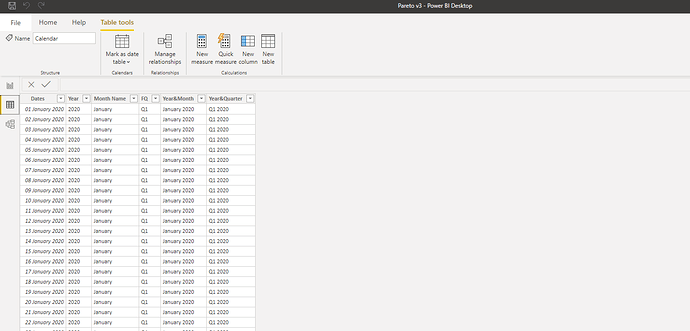
Correct the only data that I upload was Sales data, wheres Calendar I created using rolling calendar formula. City, customer and product are virtual table base on formula like summarize or values.

Thank you for correction :slight_smile: I noticed the difference between treemap, the interaction option that I had beetwen treemap and bar chart was highlights this would explain why I could only see one customer.

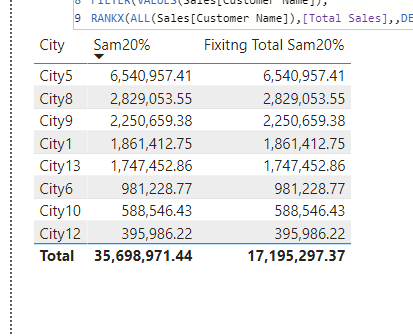
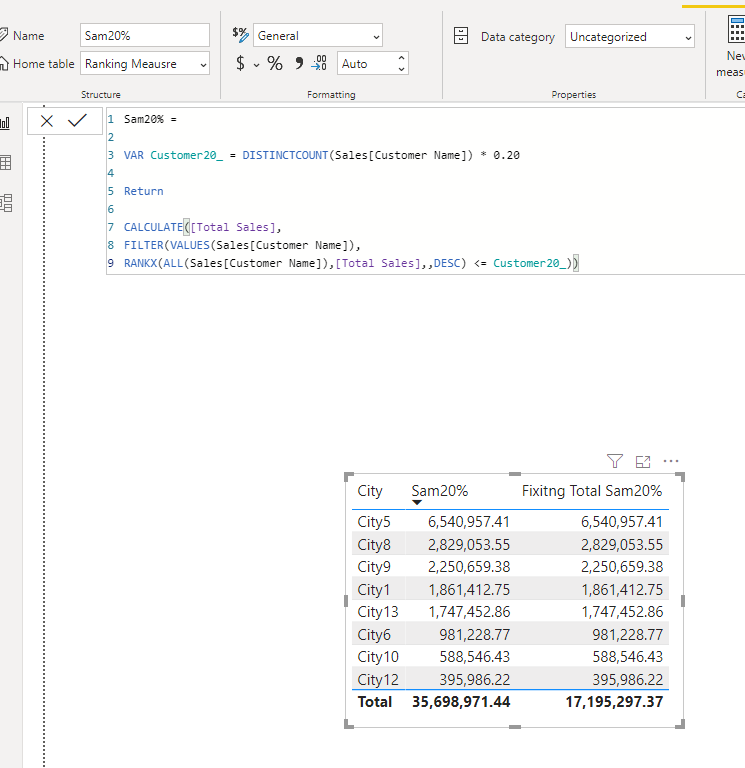
For 20% customer would you agree that below formula is not working correctly? As the results should be exactly the same as for TOP27?


image

I appreciate your help but the result for 20% customers doesnt seem to be right.
The result should be exactly the same as TOP27.

20% of all unique customers = 27.

I also notice my mistake in TOP27 if we reference in formula the customer from sales table

,
The results is incorrect as we should only see 27 customer names but actually we are getting more.
After referencing the table to customer name everything looks okay.

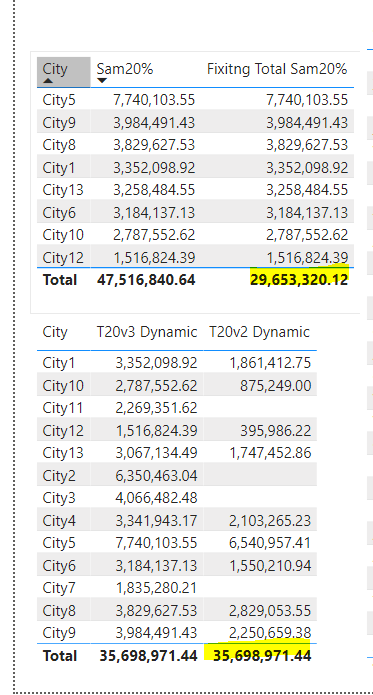
I compared your dynamic formula for 20% to TOP27 and there is slighlty issue with the totals

Now I am scratching my head why this happened.

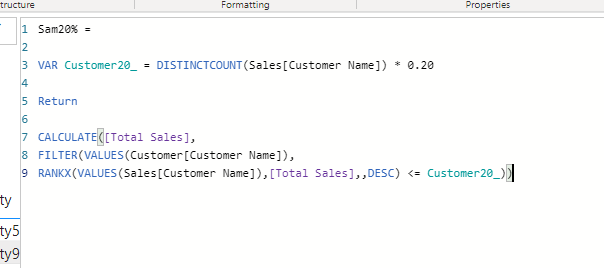
If your end statement in the formula is similiar that I had in my 20% Using Top why the total are different :open_mouth:

@Matty,

> Would you recommend any book to read about Power BI ? Currently I started reading “M for data monkey”

Check out this thread below. A number of us have been compiling our recommendations on the best Power BI books:

With Power BI its all about practicing its like cooking, you can read the book but still you wont be a chef :).

I agree with you 100%. Videos and books are great, but the only way to truly learn this stuff is practice, practice and more practice. On that topic, I’ve got a video coming out next week on the Enterprise DNA TV channel entitled “5 Strategies to Enhance Your DAX (or M) Toolbox”. Much of it addresses how to structure your practice time for maximum benefit. @Melissa also has one coming out that same week on how to construct a perpetually up-to-date practice dataset. Based on your enthusiasm for learning and practice, I think you’ll find value in both of them.

  • Brian

Hello @Matty,

My sincere apologies.

Actually I thought in your file “Customer Ranking” was calculated based on Sales Table so in my formula also I by mistake referenced it as “Sales” instead of “Customers” and due to referencing error on my part the individual line items total showed correctly but the “Grand Total” received an error.

Below are the changed formula for the reference -

Part 1 : Calculation of 20% Using Topn

20% Using TOPN 1 - Harsh = 
VAR CustomerRank = RANKX( ALL( Customer ), [Total Sales], , DESC )
VAR UniqueCustomers = CALCULATE( DISTINCTCOUNT( Customer[Customer Name] ) , ALL( Customer ) )
VAR Top20 = UniqueCustomers * 0.2

RETURN
IF( ISFILTERED( Customer[Customer Name] ) , 
    IF( CustomerRank < Top20 , [Total Sales] , BLANK() ) , 
        CALCULATE( [Total Sales] , TOPN( Top20 , ALL( Customer ) , [Total Sales] , DESC ) ) )

Alternatively -

20% Using TOPN 2 - Harsh = 
VAR Top20 = CALCULATE( DISTINCTCOUNT( Customer[Customer Name] ) , ALL( Customer ) ) * 0.2

Return
IF( ISFILTERED( Customer[Customer Name] ) , 
    IF( [Customer Ranking] < Top20 , [Total Sales] , BLANK() ) , 
        CALCULATE( [Total Sales] , TOPN( Top20 , ALL( Customer ) , [Total Sales] , DESC ) ) )

Part 2 : Calculation of 20% Using Topn - Total

20% Using Topn Total - Harsh = 
SUMX( 
    SUMMARIZE( Customer , Customer[Customer Name] , "Topn Totals" , [20% Using TOPN 1 - Harsh] ) , 
        [Topn Totals] ) 

Please Note: I’ve used Measure Branching Technique to Fix the Totaling Errors.

And as per my calculation the Total which shows for “20% Using Topn” is equal to “Top 29 Customers” instead of “Top 27”.

I’m providing the PBIX working of my file for the reference as well as a few links of videos created by Sam showing how to fix totaling errors in Power BI.

Hoping you find this useful and helps you to understand how you can fix the totaling errors. :slightly_smiling_face:

Thanks & Warm Regards,
Harsh

Pareto.pbix (109.1 KB)

https://portal.enterprisedna.co/courses/305959/lectures/11981612

https://portal.enterprisedna.co/courses/305959/lectures/13664651

Thank you @Harsh

I will definitely read other books after data monkey :slight_smile:

I updated the file with my formulas on page 6 as the 20% customer = 27 :slight_smile: Pareto v3.pbix (112.3 KB)

Previously I was really closed to get the formula working, but I referenced it wrongly. Previously I used Sales(Customer Names) instead of just a Sales table which makes sense.

T20v3 Dynamic and T20v2 Dynamic are similar whereas v2 focuses on referencing everything from sales table. V3 focuses on both so you can apply customer names filter from the customer table.

Now the formula works correctly :slight_smile:

I could be wrong but in this course, the formula I think does not work correctly as it supposes to.
Sam wants to find out: out of all sales how many sales where 20%.

I do understand the Regions context is not applied but I used the same formula and applied it to my data.

How I could resolve it? Would it be wise to use crossjoin summarize?

I would like to understand the difference between:

image

Correct me if I am wrong but both results should be the same as we want to achieve 20% of our sales but we rank them, so for its give me the top 20% customer which in theory should give you 80% of your total sales.

Advanced Dax from Mini-Series is on my list just starting Financial reporting last structured course.

Apologies @Harsh

Corrected Formula for City

image

But I am unhappy with the result, As i mentioned before.

I want to group customer per city.

Hey @Harsh

I added customer dropwown filter which show customer per city

This is why the the Sam formula confuses me to which I provided a link to.

As you can see the total results shown is correct but results for each city incorrect.

Hello @Matty,

This is being one of the trickiest question where after few hours I also started to scratch my head until I added two more columns in the table to evaluate the result :smile:.

Don’t worry the result shown in the screenshot that you’ve provided is absolutely correct. :slightly_smiling_face:

If you’ve gone through all the videos of Sam you’ll observe that he has always said that he is using the dummy data and therefore in his data Customer had purchased from different - different locations which in real life scenario is not possible that your same Customer starts purchasing from several locations unless they’re having franchise at different locations.

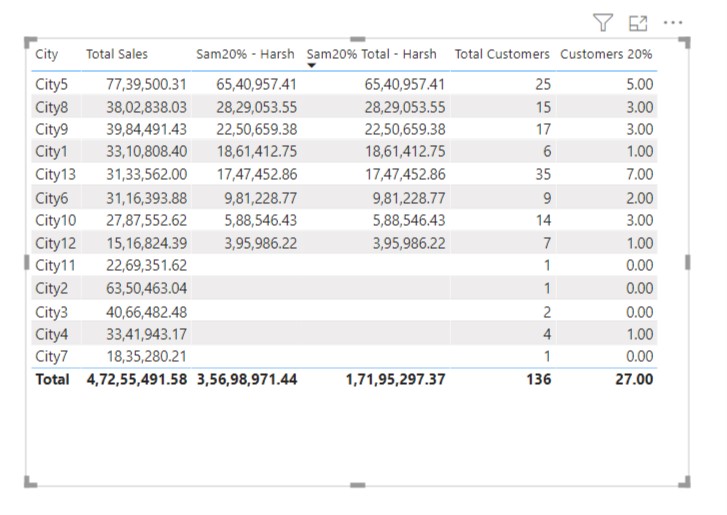
So in his data, he had Customers which were spread across the States/Region which in your case it’s not there. For e.g. If I take City 11, in that city you’ve only 1 customer and that is Jaxbean Group. Now in order to be in a “20% of Customer” Category for that particular City, it must have atleast 5 Customers present then only “20% of Customer” condition will hold true.

Because when we say 20% of Customers, it means that, 5 Customers * 20% = 1 Customer. Now, since in your data you don’t have atleast 5 Customers in the given cities as provided in the screenshot below the “Total Sales of 20% Customers” for those Cities is showing nothing -

Now, you might be wondering then why the City 4 who has only 4 Customers is showing you as 1 under "Customer 20% column. The reason is I’ve rounded of my Customer figure to Whole Number since Customer cannot be a Decimal/Partial Number and therefore the actual result of City 4 is 0.8 instead of 1.

I’m also attaching the PBIX file of my working for the reference. I’m also providing few more links of the videos available on Pareto Analysis.

Hoping you find this useful and helps you in your analysis.

Thanks & Warm Regards,
Harsh

Pareto v3 - Copy.pbix (113.9 KB)

OMG
@Harsh wow soo simple but at the same time soo hard! You have opened my eyes!

Since we are adding City as Filter then as you are showing the formula re-valuate the total customer per each city!

Last question :smiley:

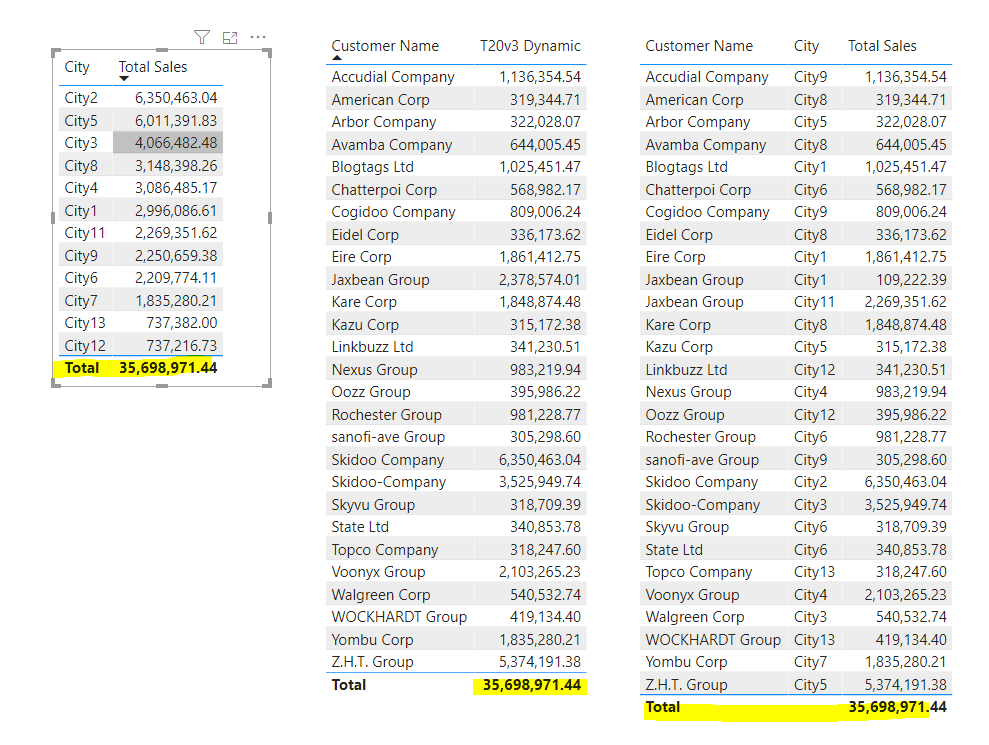
Is it possible to cross joined below table so it looks like below?:

What I would like to achieve is if Tv20v3 Dynamic is selected give me sales per city or group them by the city as a pointed arrow.

Allocate customer to each City.

Hello @Matty,

Actually I didn’t understood the question.

Can you please explain me again by elaborating the entire scenario that you want to achieve?

My sincere apologies for the inconveniences caused.

Thanks & Warm Regards,
Harsh

Hi @ Matty,

Are you trying to Group top 10 sales customers in each city? so city 1 will have 10 top customer, city 2 will have top 10 customer and so on

am i off base on this?

thanks
Keith

Hi @Keith @Harsh

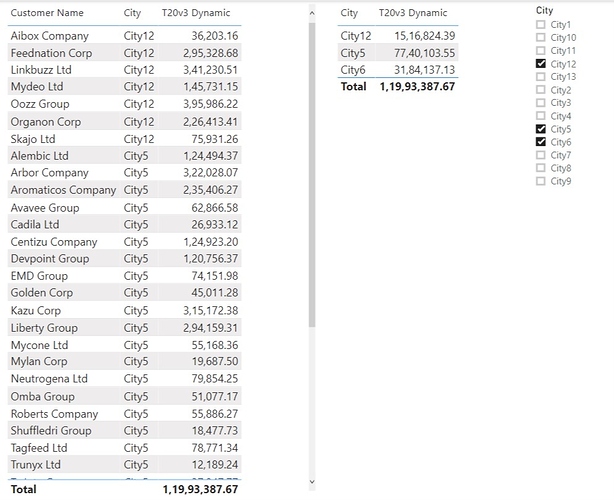
With massive Harsh help we manage to create a formula for TOP20% of my clients filter by client.

If I add another filter (city) while customer filter is on, then the data remains correct.

Base on that T20v3 Dynamic I would like to create a grouped table to have Customer name and City then I would be able to display only City filter.

I would like to know if its possible using AddColumn( Crosjoin ) to join both tables ?

In other to find out to which city customer realtes I have to apply addional filter.

Or I would like to shows summary by City for customer that are in T20V3 Dynamic.

I can only do that if I manually select individual customer using dropdown filter.

Hello @Matty,

I’m providing a screenshot below. And as per my understanding this is what you’re saying right now when you apply additional filters in place. Right?

Now, after having this scenario, from here actually I’m not able to understand “how” and “why” do you to use CROSSJOIN formula?

Thanks & Warm Regards,
Harsh

@Harsh

I was thinking if its possible to create table in data section, since there is no relationship, but if this is no possible then okay :).

Thanks for your help :slight_smile:

Hello @Matty,

You’re welcome. :slightly_smiling_face:

I’m glad I was able to help you.

Thanks & Warm Regards,
Harsh