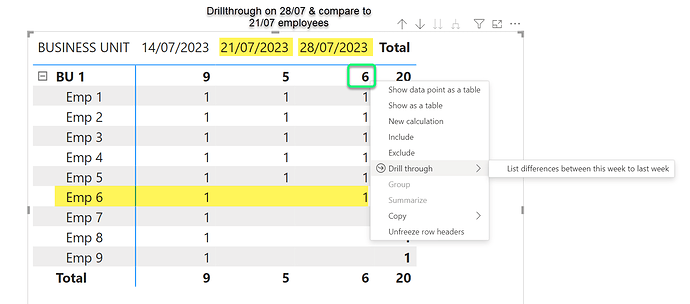
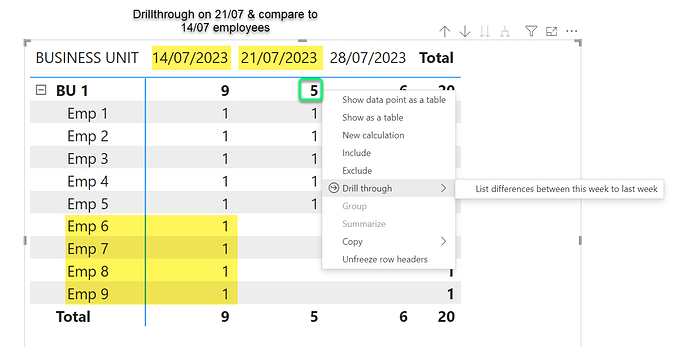
Output the difference in a list of employee names between 2 reporting weeks

Hi,
Hoping that someone can provide some advice on my problem. It is somewhat similar to the post: Visualize virtual tables.

I have a Matrix that shows a count of employees by reporting week.
I would like to be able to output a list of employee names when comparing 2 reporting weeks to identify what names appear in one week but not the other week.

If the count of employees is less than the previous week then they have left the business and I want to know who they are.
If the count of employees is greater than the previous week then there are new hires and I want to know who they are. If it is some combination of leaver and hires I would like to know the employee names.

Ideally, I would like to output this list via a drillthrough. I want to right click on a particular week’s headcount and be able to see the list of employees. I have tried using a combination of CONCATENATEX & EXCEPT, however, I have not been successful in outputting a list of names.


Output1

Output2

Employee List Differences.pbix (79.8 KB)

Hi @Kazza - Please check the attached solution. I have created a new .Disconnnected table to act as Dimension table and a new measure Diff to get list of Employees that are added or removed.

Please check and let me know if this works or any issues.

Employee List Differences.pbix (84.3 KB)

Thanks
Ankit J

Hi,
Your solution is amazing, and I have learnt a lot from it! It works well within the sample pbix I uploaded; I added further sample data into it, and it worked as expected. I am trying to implement it into my Dashboard. I’m unable to get the results that I want. I will continue to troubleshoot it; it could be the way my Matrix is set up.

Is there a way to output the list of employees contained in the variables that you have used so that I can troubleshoot?

I think I understand the DAX, you are looking up between the selected week’s list & the total list to find the exceptions and then also looking up between the previous week’s list and the total weeks list to find the exceptions and then creating the union of the exceptions?

I don’t really understand the dax for var c. Why is there an ALLEXCEPT on the Business Unit?

Are you able to provide a bit of an explanation of the way you’ve constructed your DAX so that I can better understand how the DAX is working? Thank you!

Kind regards,
Kazza

Hello @Kazza - Please find logic below.

var a = SUMMARIZE(Employees,Employees[EMPID])

var PrevWeek = max(Employees[PREVIOUSREPORTINGWEEK])

var c = SUMMARIZE(filter(ALLEXCEPT(Employees,Employees[BUSINESS UNIT]),Employees[REPORTINGWEEK] = PrevWeek),Employees[EMPID])

var d = EXCEPT(a,c)

var e = EXCEPT(c,a)

var f = union(d,e)

return

if (max('Table'[EMPID]) in f,1,0)

var a - As it is Drillthrough page, it will be filtered to the Selected week. So it returns list of employee id from Current week.
var PrevWeek - To get the Date for Previous week. As it is part of data, I have taken from there directly else it will be Current week - 7.
var c - To get the list of employees for Previous week. ALLEXCEPT(Employees,Employees[BUSINESS UNIT]) is used to keep the Filter for business unit as it is being passed from the Parent page. If there will be only single Business unit, then this can be removed. Additionally if any other filter is being passed from Parent page, then that needs to be added here.

Rest is straightforward.

Thanks
Ankit J

Hi,
Appreciate the explanation. All makes sense.
I have implemented your solution into my dashboard, and it all works well except when the count of the empid for the reporting week selected is less than the count of the empid for the previous reporting week. It is as if it’s not accurately deriving the employee list for the previous week.

I will keep troubleshooting it as in the solution you provided it works for this scenario. When I drillthrough on reportingweek = 21/07, where the empid count = 5; previous week = 14/07 emp id count = 9.
Any advice/tips as to what could be causing this would be great!

HI @Kazza

When i look at the data tables for employee. I see that for the following reporting total 1407 = 9 2107 = 5 and 2807 = 6.

Is your data correct for that time frame (2107)?

Its just a thought your data isn’t fully combined properly at the beginning.

thanks
Keith

Hello Keith,
Thanks for your reply.
To the best of my knowledge, it is correct. If you look in power query 21/07 has 5 emp id’s listed. Ankt’s solution works well with the sample pbix I uploaded.

I’m not too sure what you mean by “the data isn’t fully combined”.

Regards,
Kazza

all i’m saying is your data correct when the data was combined. To me it looks like the employee number 6 was missing thats all.

Have you tried using datamentor/EDNA AI tools to see if it can help with a solution?

I put this in DataMentor and this what comes up.

I have a Matrix that shows a count of employees by reporting week.
I would like to be able to output a list of employee names when comparing 2 reporting weeks to identify what names appear in one week but not the other week.

If the count of employees is less than the previous week then they have left the business and I want to know who they are.
If the count of employees is greater than the previous week then there are new hires and I want to know who they are. If it is some combination of leaver and hires I would like to know the employee names.

Ideally, I would like to output this list via a drillthrough. I want to right click on a particular week’s headcount and be able to see the list of employees. I have tried using a combination of CONCATENATEX & EXCEPT, however, I have not been successful in outputting a list of names.  is there a better solution?

Results:

To achieve this functionality in Power BI, you can follow these steps:

Dataset Preparation

  1. Ensure you have a dataset that includes employee names, reporting weeks, and respective statuses (e.g., still employed or left).

Measures for Identifying Changes

  1. Create measures to identify employees who left and those who were newly hired:
EmployeesLeft = 
CONCATENATEX(
    EXCEPT(
        VALUES(Employee[EmployeeName]),
        CALCULATETABLE(
            VALUES(Employee[EmployeeName]),
            PREVIOUSWEEK(CALENDAR[Date]),
            ALL(Reporting[Week])
        )
    ),
    Employee[EmployeeName], ", "
)

NewHires = 
CONCATENATEX(
    EXCEPT(
        CALCULATETABLE(
            VALUES(Employee[EmployeeName]),
            PREVIOUSWEEK(CALENDAR[Date]),
            ALL(Reporting[Week])
        ),
        VALUES(Employee[EmployeeName])
    ),
    Employee[EmployeeName], ", "
)

Drillthrough Setup

  1. Create a new drillthrough page:
  • Add a matrix visual and include the measure EmployeesLeft for employees who left.
  • Add another visual for NewHires for newly hired employees.
  • Set up the drillthrough using the relevant date filter (e.g., Reporting[Week]).

Applying Drillthrough

  1. Set the drillthrough feature on your matrix:
  • Configure the matrix in your original report view where you have the employee counts by week.
  • Right-click on a specific week’s headcount and use the drillthrough to navigate to your newly created detail page to see employees who left or were newly hired.

Combining Results

  1. If you need a combined list of both new hires and leavers, you can create an additional measure:
EmployeeChanges = 
"New Hires: " & [NewHires] & " | Leavers: " & [EmployeesLeft]
  1. Add this measure to your drillthrough page.

Final Result

With these steps, you can right-click on a week’s headcount and drillthrough to see detailed employee lists for that specific week. Customize this setup according to your data structure and specific needs.

Note

Ensure that your data relationships and calendars are correctly set up in Power BI. This will enable accurate calculations when using time-based functions like PREVIOUSWEEK.

If you encounter any specific issues or errors, please provide details so that I can help troubleshoot further.
thanks
Keith
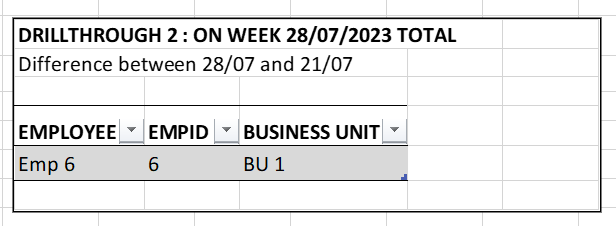
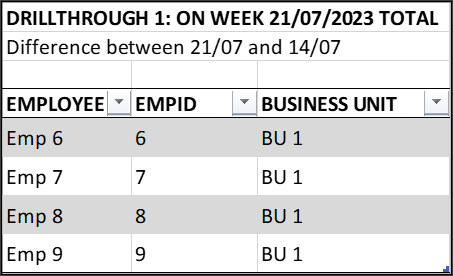
1 Like

Hi - Can’t say as it is working fine on the data shared. Do check all the employees are available in the new table I have created.

If still facing issue then will need actual data to check. Anyways will suggest to close this post and start a new one so others can help also.

Thanks
Ankit J

Hi Ankit,
I believe that Your solution is correct, however, the user wants something different now. Many thanks for your efforts, this has been a very good learning experience for me.

Regards,
Kazza.

Hi Keith,
Apologies for the late response. Thank you very much for your detailed solution. The requirements that I have been given have changed again, however, I will be using your suggested measures elsewhere in the Dashboard.

Regards,
Kazza

1 Like

thanks for the reply and good luck :slight_smile: