I am doing an Outlier Detection (similar to Sam videos) on Outlier Detections.
However I am giving it my own spin and looking at my “customer who have an oulier detection based on a number of parameters per quarter” .
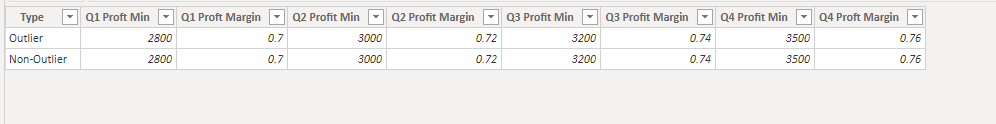
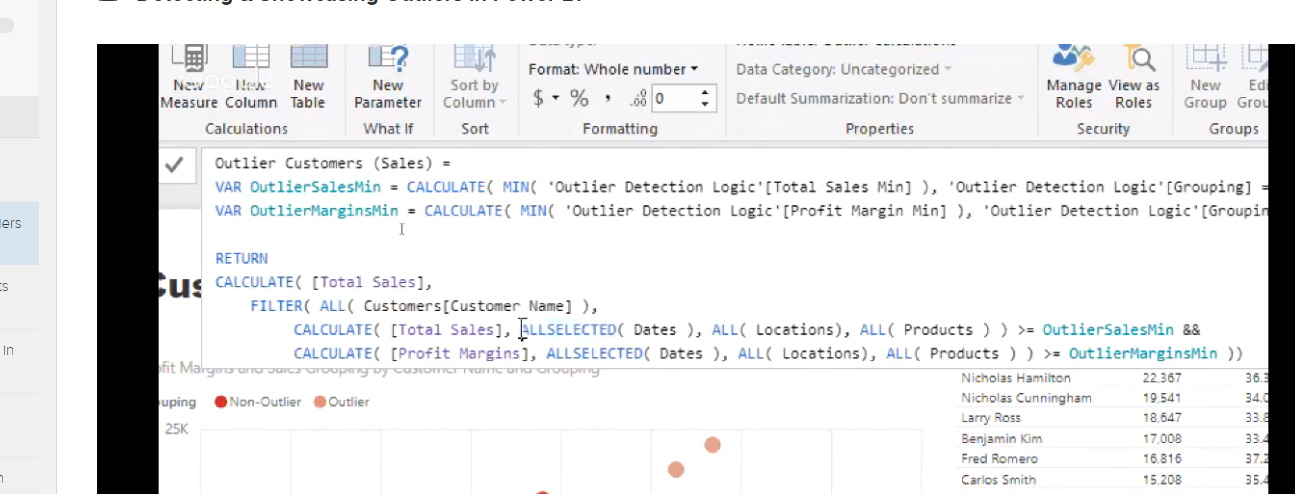
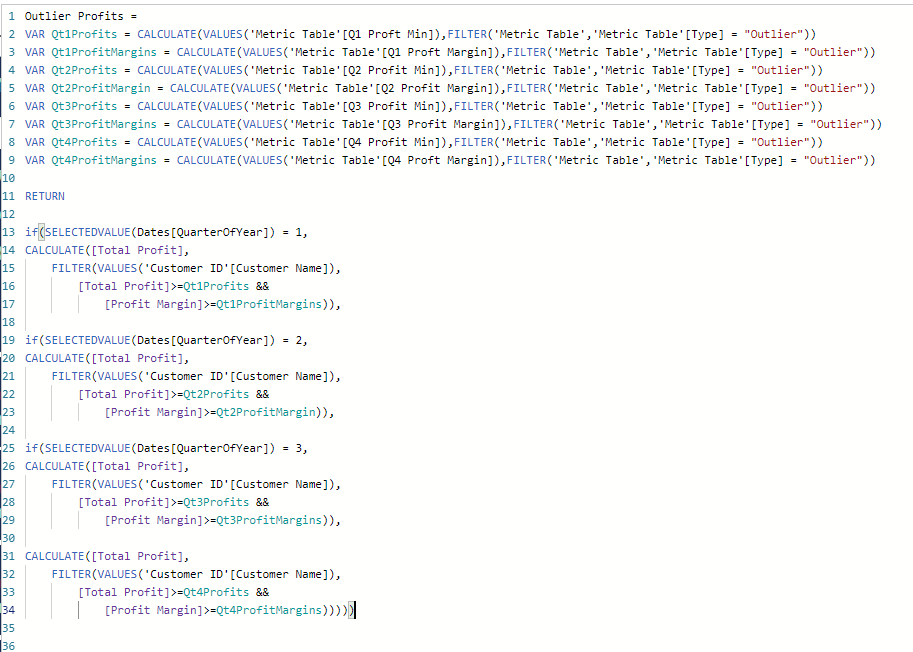
When Profit and Profit Margin >=my Outlier Type, is seen as an “Outliers”
When Proift an Profit Margin < Non-Outlier Type, is seen as an “Non-Outlier”
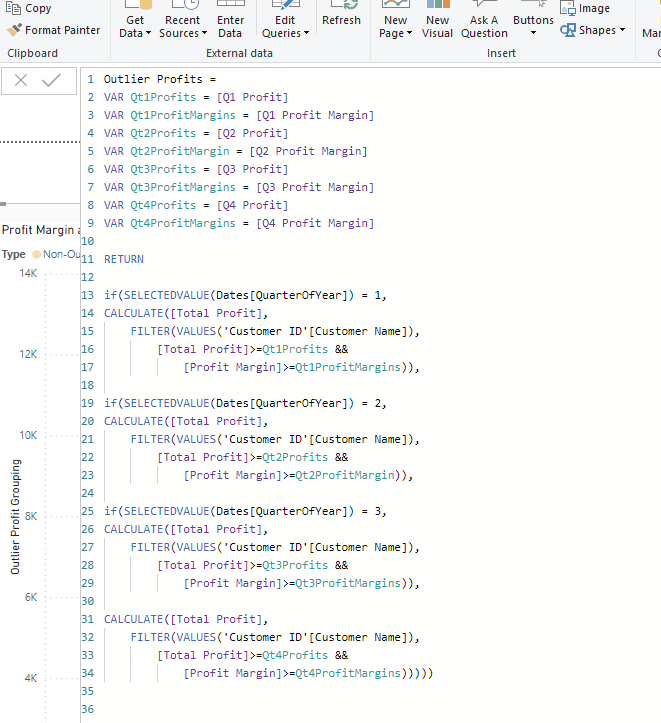
My Dax looks fine.I’ve checked this. (see page 2)
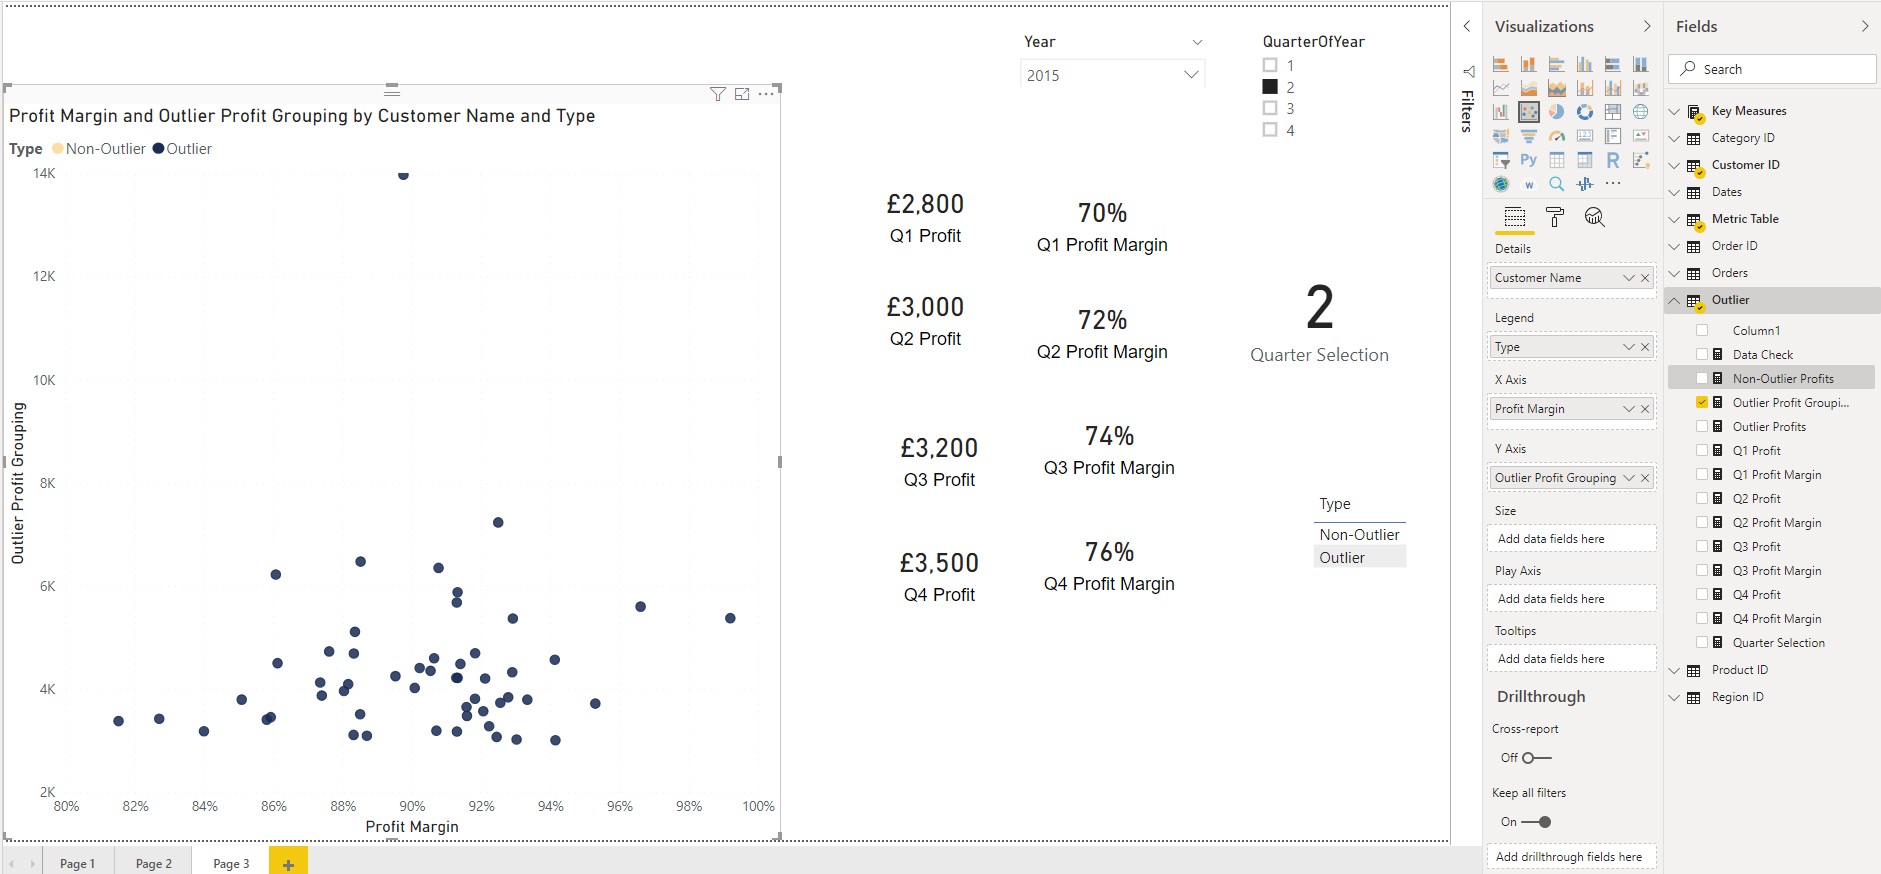
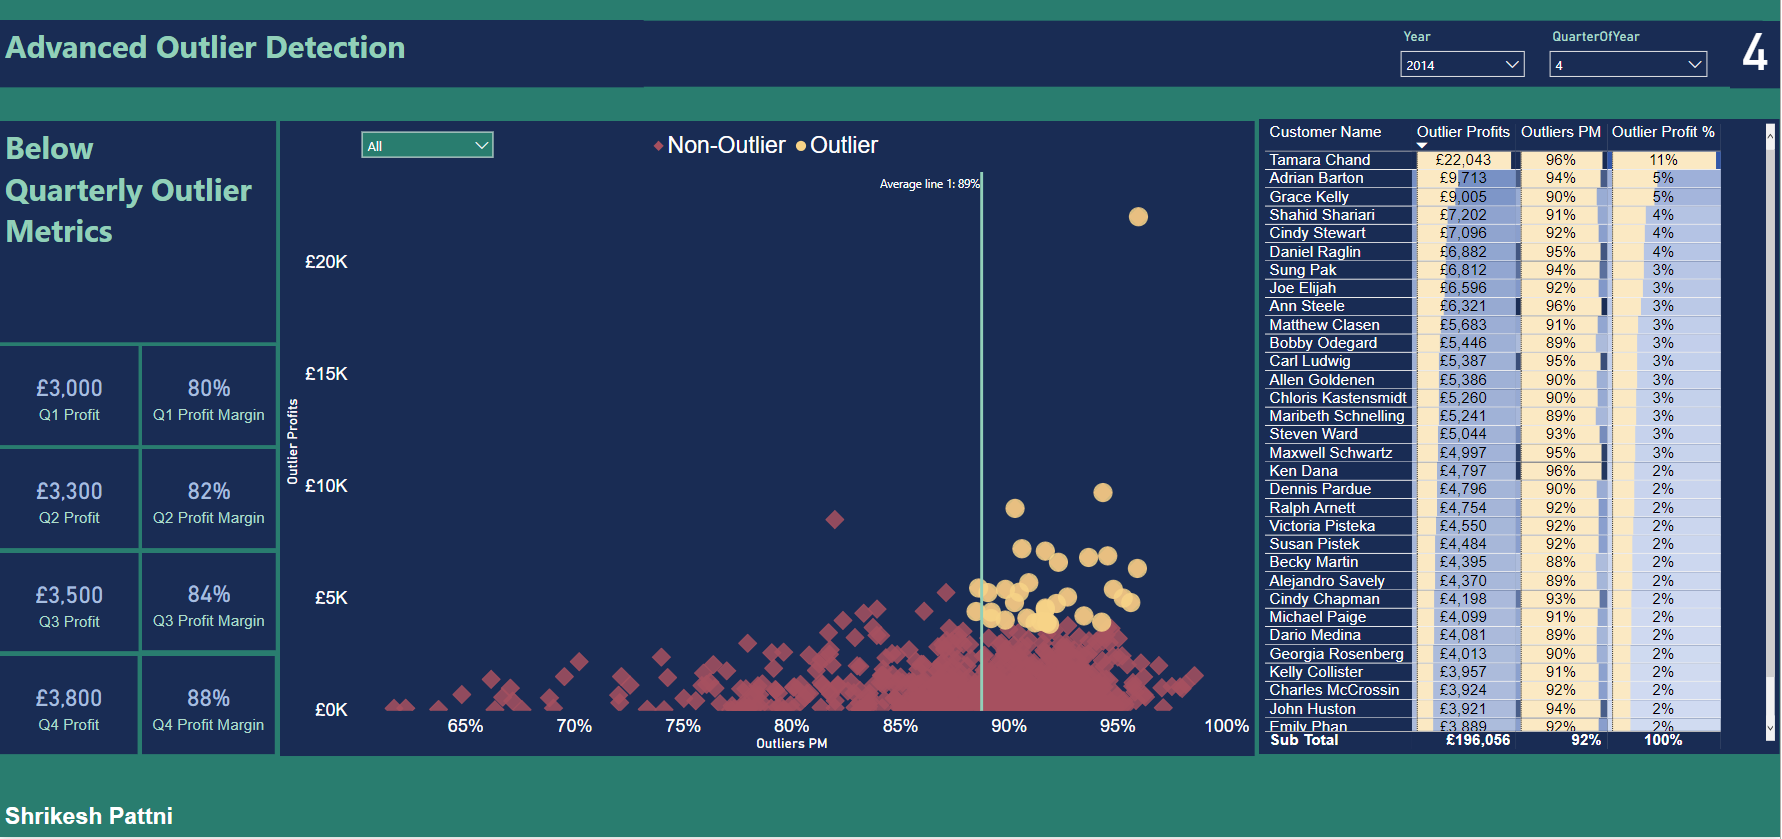
It is really confusing me because on my scatter plot my “Non-Outliers” I cannot see. It is only showing “Outliers”, not sure why “Non-Outliers” are being hidden.
Have you gone very slowly through the examples and tutorials already provided around this particular technique.
This has been quite comprehensively detailed I feel in these tutorials.
I have your formula is not working as you think it should it is likely because the technique you’re using is not matching up to the examples provided here.
I would work through these very slowly and make sure they match up exactly to what you have done in your model.
So the techniques I’ve used for this all underpin your best practices for Power Bi Outliers.
The inspiration on this was based on “Detecting & Showcasing Outliers”
So Sam even though my techniques are similar to yours, I’ve had to tweak mine slightly.
In this scenario I am looking at my outliers quarterly.
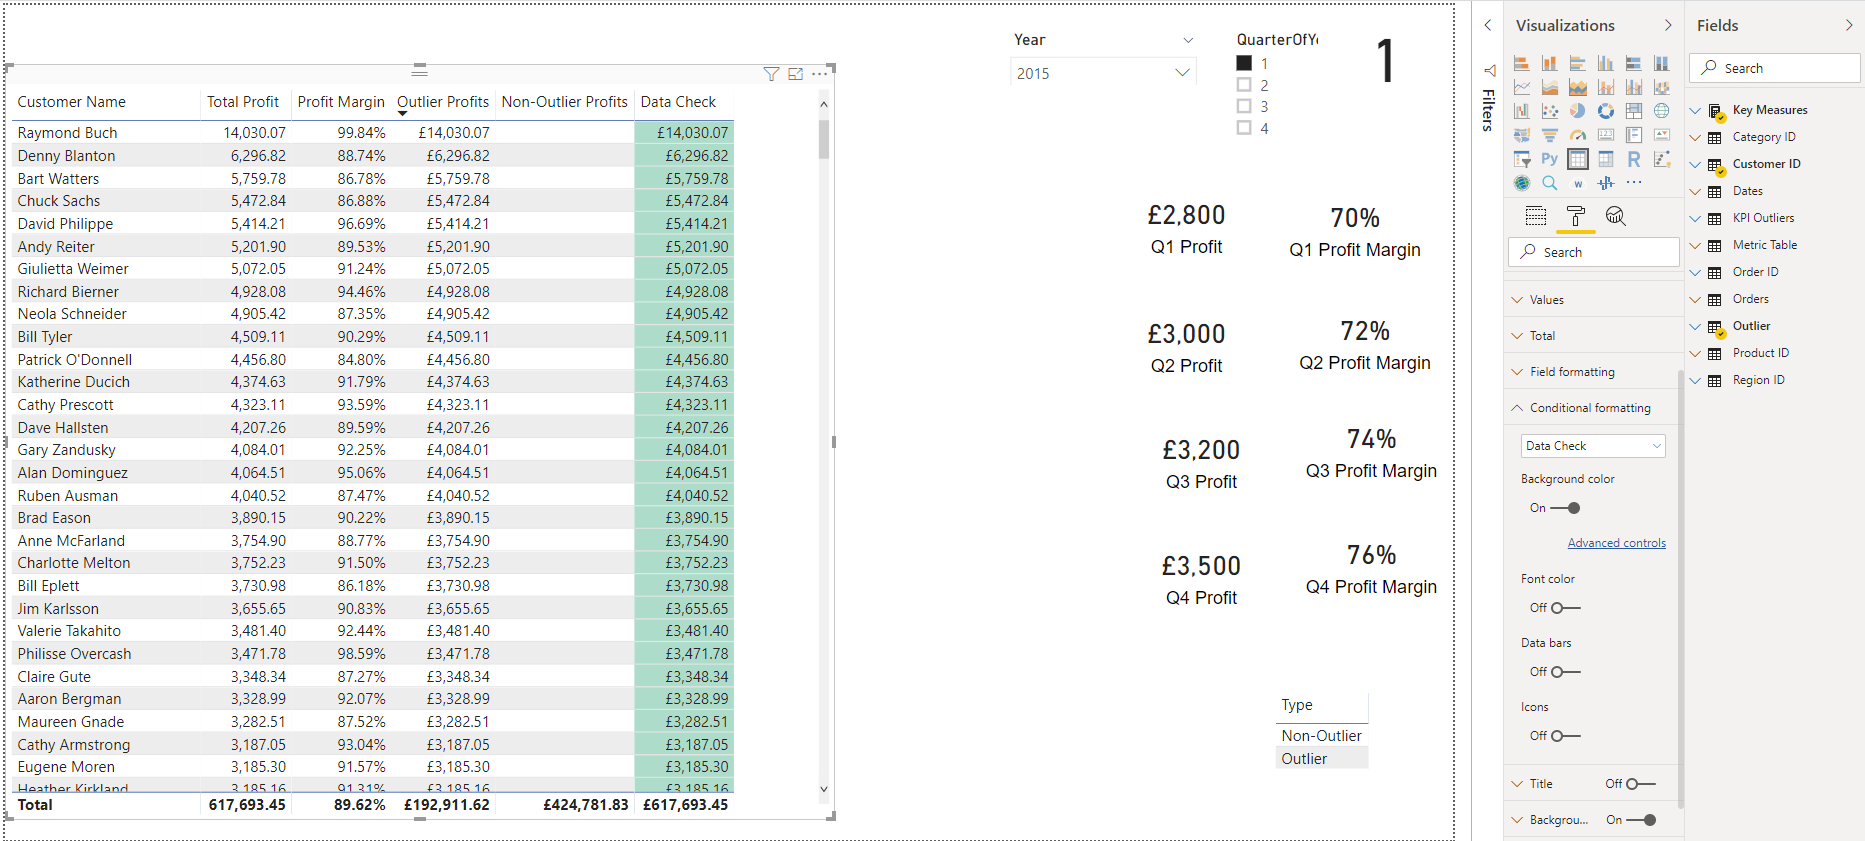
Thing is Sam when i have audited my DAX this looks good to me. Look at “Data Check” below.
Data check = Outlier Profits + Non-Outliers = should be same as profits! Happy days!
Thanks for the advice on this! beat you to it actually
I know what you mean, that’s where I was going wrong actually was in the variables itself.
Just thought I wanted to challenge my skills on this type of analytics, and have set outliers per quarters instead of just 1 set of numbers. What do you think so far of the end output?
Slight difference you have used MIN in your Variables.
I prefer VALUES or SELECTEDVALUE I use sometimes.
I guess main thing is it gets me the same outcome.
Thanks to the contributors of this post. Due to the length by which this post has been active, we are tagging it as Solved. For further questions related to this post, please make a new thread.