Hi all
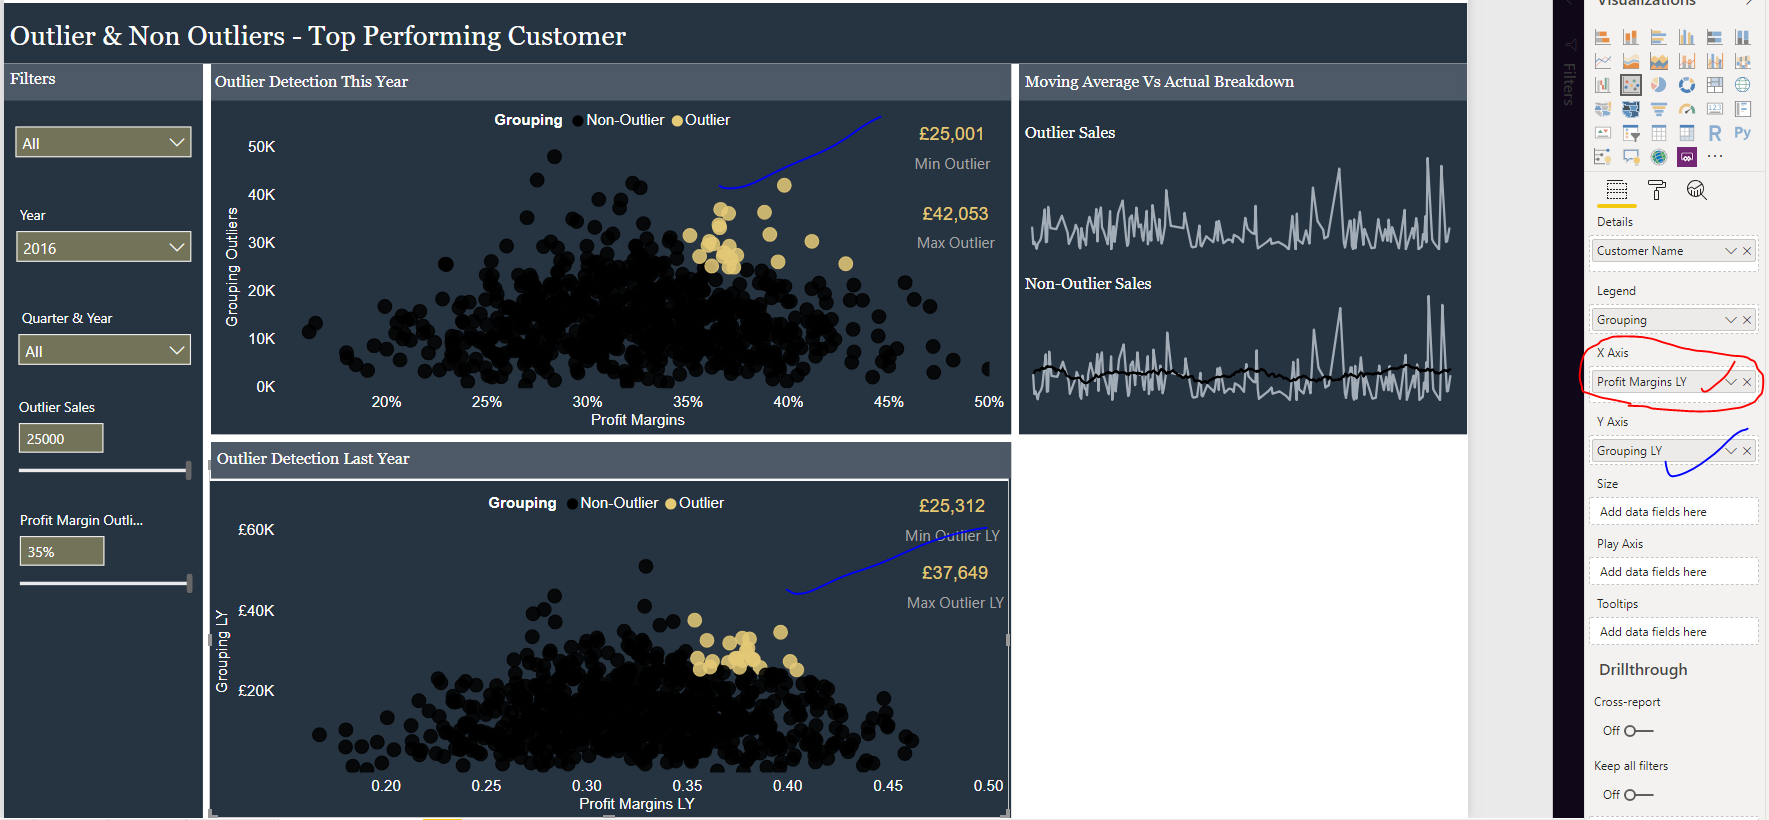
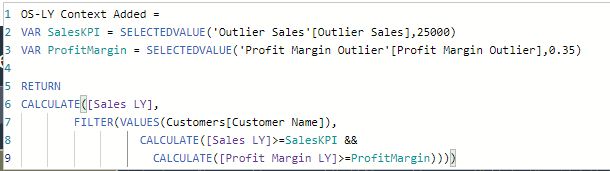
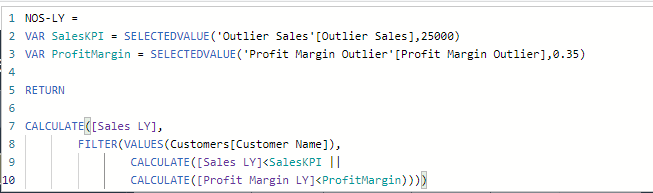
I am looking at Outliers measures based on “last year” results, for Sales and Profit Margin LY only.
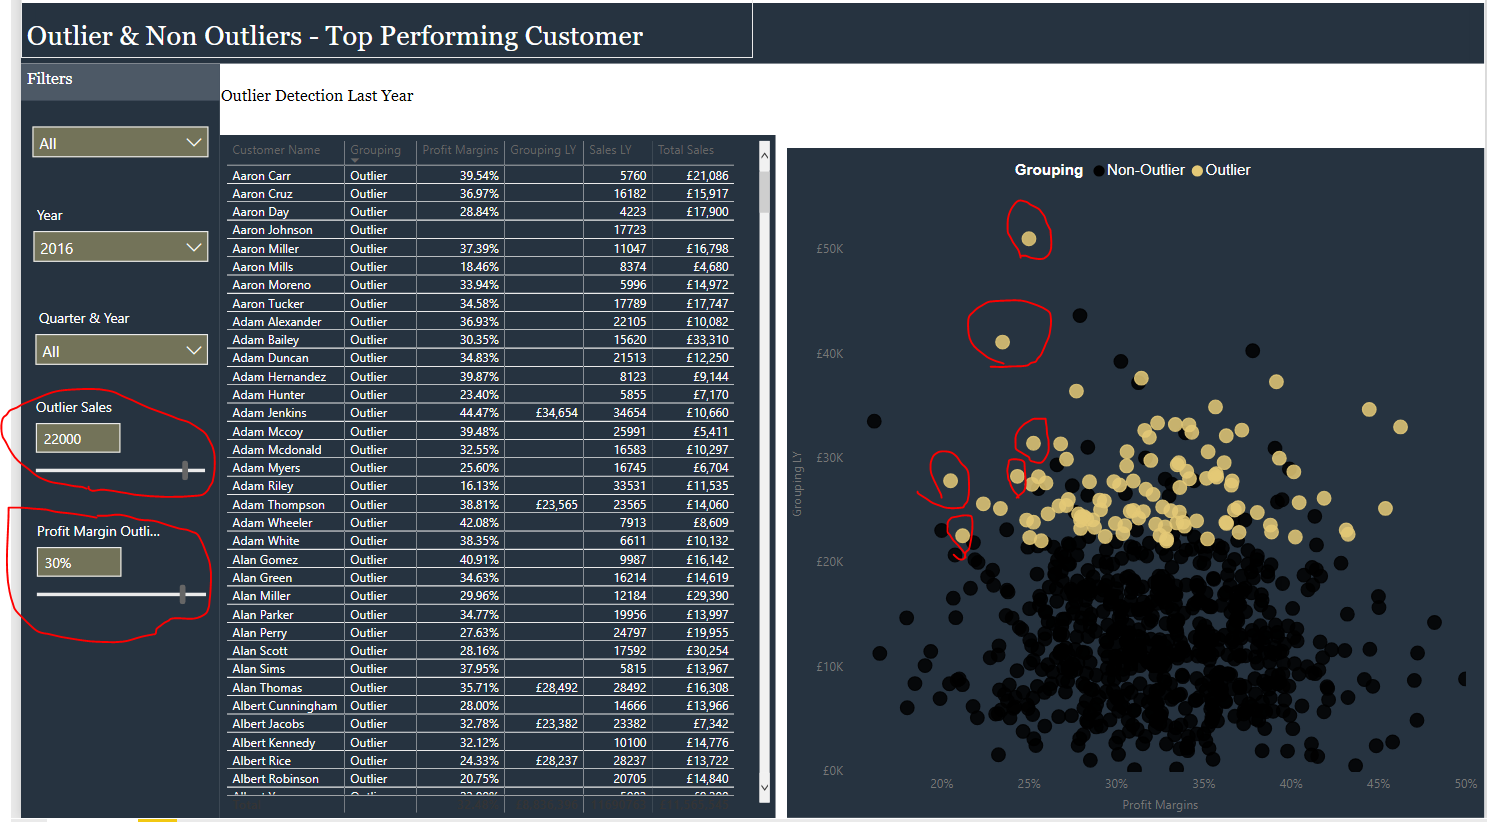
For some really odd reason I get non-outliers when actually the Sales and Profit Margin LY is actually an Outlier.
Example below Non-Outliers are actually Outliers.
Brandon Diaz, her Sales LY and Profit LY is actually above my threshold parameter.
So really puzzled why it is saying “Non-Outlier”.
Same, for Outliers. shows Outliers where they are actually Non-Outliers.
I’m just having some trouble downloading the pbix file at the moment, but some advice below.
I would really closely check the formula you have in the visual. To me the formulas look ok so I’m not exactly sure what could be the issue without being able to dig into the model.
Also really think hard about what each value is doing in each context. That will be the key to working this out.
Hey Sam. Hope your well.
I understand what you mean, but I would not have posted my problem If i didnt in the first instance look closely where my problem is.
It would be nice if you could just appreciate DAX can sometimes be a complicated language. Especially when extracting I would say pretty advanced insights. Especially when either adding in or leaving out context…hmm, strange seems to open fine on my laptop…

 ’
’