Hi, I am currently running what I think to be a simple dax formula as described below.
Units Sold Last 12 mths =
CALCULATE([Units Sold],
	DATESBETWEEN('Dates'[Date],
		DATEADD(
          	LASTNONBLANK(Stock[Sales Date],[Units Sold]),-12 ,MONTH),
			LASTNONBLANK(Stock[Sales Date],[Units Sold]))) + 0
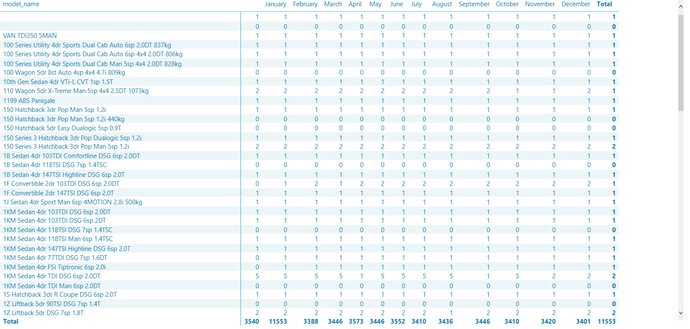
I am simply calculating the number of units which were sold in the last 12 months, this function works fine, however, when placed into a matrix visualization (see photo) it is consumes an immense amount of time to process and resources (up to 10GB in Memory and 99% CPU usage). Note* when i place a simpler dax formula instead of the one described above such as “Units Sold” it consumes far less time and resources.
Units Sold = CALCULATE(DISTINCTCOUNT(Stock[VIN]), FILTER(Stock, Stock[Sales Date] <> BLANK())
I am looking at either a new way to visualize the data (needs to be table form) or an alternative solution to the dax formula which is better optimized. Also Note there is over 4000 different types of models which may also be why it is very resource hungry, which is why maybe a new way of representing/ handling it may be required then a formula.
The following image is the matrix using units sold last 12 months (which took roughly 30 minutes to create and any alterations make it load all again)
Cheers,
