One Dimension, Multiple Facts -and- Multiple Interconnected Facts

@mickeydjw

I’m wondering why there’s a Sales_Invoice and Sales_Invoice_Line as well as well as the same with Orders. Why the 2 tables?

In my original model, I had a single query for both Sales_Invoice and Sales_Invoice_Line, combined.
Similarly, I had a single query for both Sales_Order and Sales_Order Line, combined. Header values were repeated on every line.

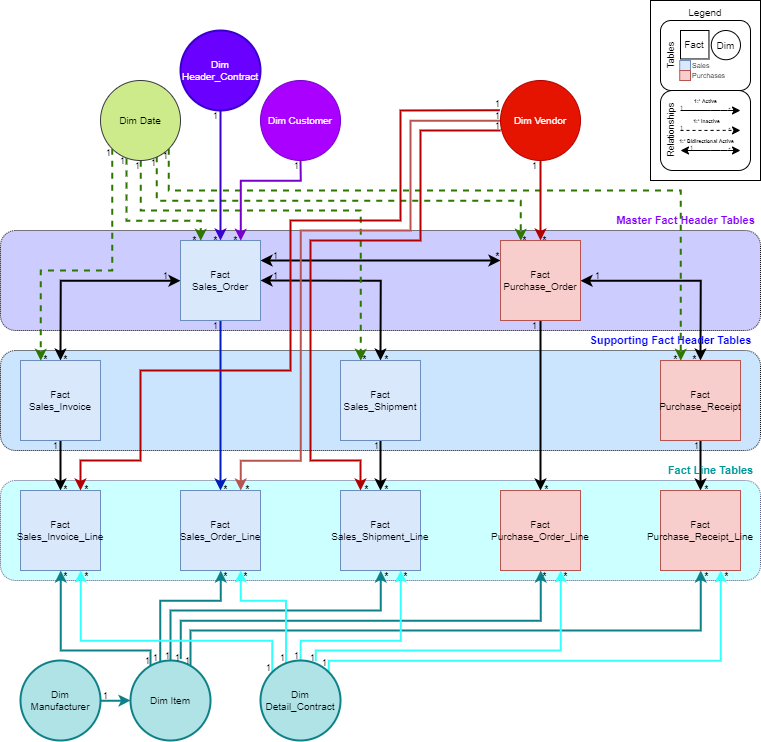
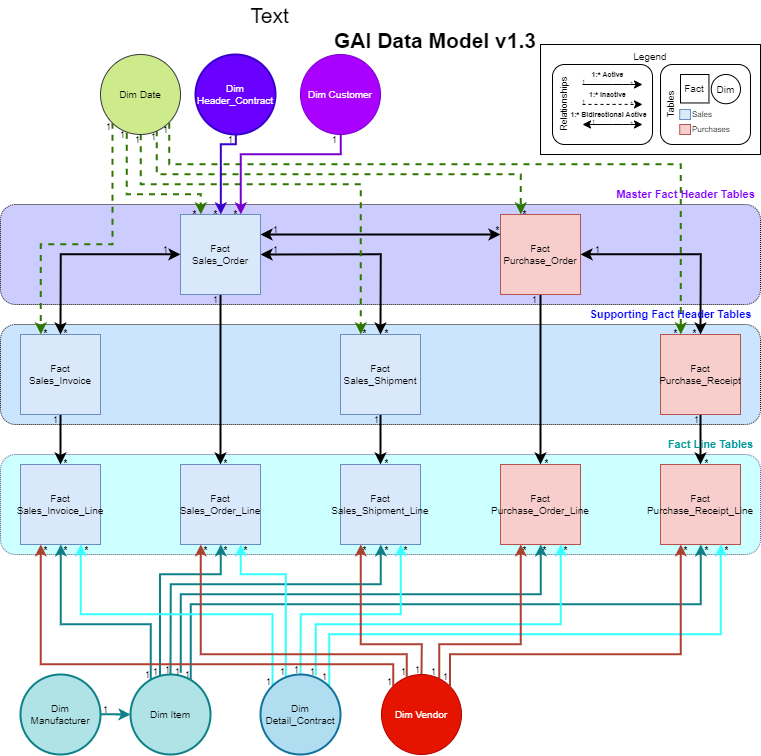
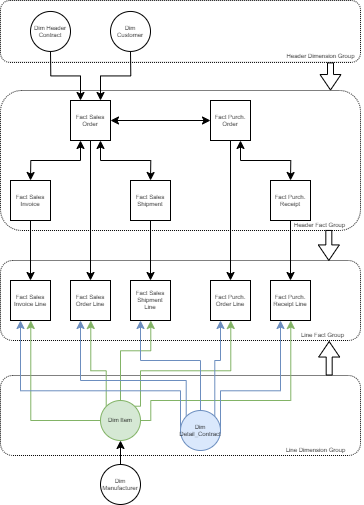
I didn’t think it would be good to leave those header and line tables combined. The main thing driving me to refactor this data model was to create relationships between my various fact tables, specifically:

  • Sales Orders [1:*] with Sales Invoices,
  • Sales Orders [1:*] with Purchase Orders,
  • Purchase Orders [1:*] with Purchase Receipts
  • Sales Orders [1:*] with Sales Shipments.

If I leave these fact tables connected as they are (see original post’s data model diagram), I think I need lines and headers in separate tables to preserve the 1:* relationships between fact tables. Conversely, If I was to combine header and line tables, I wouldn’t be able to connect my fact tables to each other without creating : relationships.

Also, when it comes to simplifying, a Key_Measures table fixes a ton, that way you’re not recreating calculations within new measures and instead measure branching.

I basically do have a Key Measures table, but am having a great deal of difficulty determining how to create both Booked (Sales Order) and Invoiced (Sales Invoice) measures, which is the current issue I’m facing.

Some of my key measures, all of which are struggling to cope with my data model:

Ext. List =
	CALCULATE(
SUMX('Fact Sales_Order_Line','Fact Sales_Order_Line'[Quantity] * 'Fact Sales_Order_Line'[Unit List]),
		USERELATIONSHIP('Dim Dates'[Date], 'Fact Sales_Order'[Order Date])
	)

Ext. Cost = 
	CALCULATE(
SUMX('Fact Sales_Order_Line','Fact Sales_Order_Line'[Quantity] * 'Fact Sales_Order_Line'[Unit Cost]),
		USERELATIONSHIP('Dim Dates'[Date], 'Fact Sales_Order'[Order Date])
	)

Ext. Price = 
	CALCULATE(
SUMX('Fact Sales_Order_Line','Fact Sales_Order_Line'[Quantity] * 'Fact Sales_Order_Line'[Unit Price]),
		USERELATIONSHIP('Dim Dates'[Date], 'Fact Sales_Order'[Order Date])
	)

Ext. Discount = [Ext. List] - [Ext. Price]

Gross Profit = [Ext. Price] - [Ext. Cost]

Inv. Ext. List = 
	CALCULATE(
SUMX('Fact Sales_Invoice_Line', 'Fact Sales_Invoice_Line'[Quantity] * 'Fact Sales_Invoice_Line'[Unit List]),
		USERELATIONSHIP('Dim Dates'[Date], 'Fact Sales_Invoice'[Posting Date])
	)

Inv. Ext. Cost = 
	CALCULATE(
SUMX('Fact Sales_Invoice_Line', 'Fact Sales_Invoice_Line'[Quantity] * 'Fact Sales_Invoice_Line'[Unit Cost]),
		USERELATIONSHIP('Dim Dates'[Date], 'Fact Sales_Invoice'[Posting Date])
	)

Inv. Ext. Price = 
	CALCULATE(
SUMX('Fact Sales_Invoice_Line', 'Fact Sales_Invoice_Line'[Quantity] * 'Fact Sales_Invoice_Line'[Unit Price]),
		USERELATIONSHIP('Dim Dates'[Date], 'Fact Sales_Invoice'[Posting Date])
	)
	
Inv. Ext. Discount = [Inv. Ext. List] - [Inv. Ext. Price]

Inv. Gross Profit = [Inv. Ext. Price] - [Inv. Ext. Cost]

@mickeydjw, @BrianJ

Here’s some demo data specifically pertaining to this issue. PBI Demo Order Invoice Relationship (2).zip (148.5 KB)

I felt so confident two days ago, and now I’m reconsidering whether I’ve had an epiphany or just a rush of hubris. There’s some crucial rule I don’t know I’m violating in my data model, and some part of my approach is entirely wrong. I don’t know where to look.

Here’s what I tossed together. Is this what you were looking to achieve?invoice cost updated.pbix (132.0 KB)

@mickeydjw,

Hmm, so the bi-directional relationship could be a missing ingredient.

You’ve got a bi-directional many:many relationship here, and have combined the header and line data into a single table.

I need to go train on bi-directional relationships. @sam.mckay has specifically forbidden me from utilizing them, but he also doesn’t include multiple linked fact tables in most (any?) of his content.

I’ll also need to train on many:many relationships, because again I feel I have been shepherded away from using them whenever possible. I need to make sure I know what I’m getting into before I rebuild this model using these methods.

If you know of any resources, which may need to be external to Enterprise DNA, please share.

[Edit: I wonder if I can leave my headers and lines separate, turn on this bi-directional relationship, and not have to deal with the many:many portion. Researching…]

Everyone will tell you to shy away from bidirectional relationships. Myself included. The only thing that I did to what you sent was simplify the fact tables and ensure the calculations worked. As you add complexity to your model, bi-directional filtering becomes more risky, and isn’t recommended.

I think a saving grace may be that all the bi-directional relationships I would like to add are in essentially the same layer of the waterfall, and are always between facts. I’m hoping these consistencies will squelch some of the ill effects I would otherwise see.

@CStaich,

Below are some excellent free resources on how to handle many-to-many relationships. However, once you’ve been through the Enterprise DNA data modeling resources, the next one I would highly recommend if you or your office are willing to spend some $ is the SQLBI data modeling course. I took it in person at MBAS last year, but their video training also is excellent (and much cheaper):

Articles and videos:

Different-types-of-many-to-many-relationships-in-Power-BI.pdf (1.8 MB)

I’ll also take a look at your PBIX file. May be able to avoid bi-directional entirely via data modeling changes, but if not, may be able to make the necessary relationship inactive, but utilize it as needed via CROSSFILTER.

Hope this is helpful.

  • Brian
2 Likes

@CStaich,

I think I struck gold here - check out this link to Google Books, containing the full text of the chapter on invoice/order data models from Russo and Ferrari’s, “Analyzing Data with Power BI and Power Pivot for Excel”, which walks through in great detail how to properly set up exactly the model you are wrestling with.

  • Brian
1 Like

@CStaich,

One other thought – have you taken a look at this showcase?:

It doesn’t have the header/multiple line structure that makes your specific case more complex, but you may be able to draw some useful insights from it regardless.

I agree with @mickeydjw that denormalizing your model down to two fact tables, one for orders and one for invoices is going to be key.

  • Brian

All,

I’ve done some thoughtwork and some whiteboarding and here’s what I arrived at. I think @mickeydjw had a great suggestion with the bidirectional relationships. As I don’t have a ton of experience data modeling, I hadn’t considered using these.

Here’s my revised data model.
PDF is better: GAI Data Model v1.2.pdf (170.8 KB)

It seems to me that every time I am advised against using bidirectional relationships, the example shows two dimensions connected. The caution is that bidirectional relationships cause dimensions to filter each other down. In this diagram, the only bidirectional relationships are between my fact tables. (Master and Supporting Fact Headers). I think I am safe to connect the tables this way, and this may be a case where bidirectional relationships truly shine.

E.g. if I select a Sales_Shipment Header, I do want my other fact tables to be filtered.

I am still avoiding many:many relationships, and have opted to leave my header and lines tables separate.

Now, I have identified one specific circular relationship in the model. I am not entirely sure how this will come into play, but I have a feeling it is inconsequential.

Vendor -> Sales Order Line
Vendor -> Purchase Order -> Sales Order -> Sales Order Line

I suppose I may be able to change how the Vendor dimension connects, and instead of attaching it to the Purch. Order header, I could attach it to both Purch. Order lines and Purch. Receipt lines like I do for the Sales side.

I think this is the only circular relationship!

I have not thrown this into PBI yet, so I will likely return with the realization that something else is wrong. Stand by!

@CStaich,

You are clearly putting in some great thought on this data modeling effort. However, before you go down the path of multiple (or any) bidirectional relationships, I would urge you to read this article carefully:

The absence of circular references doesn’t at all mean that you’re home free. As the article discusses in detail, ambiguous relationships are potentially even more dangerous, since they won’t necessarily throw an error message, but can produce nonsense results, or worse - incorrect results that aren’t obviously nonsense.

I can already see one ambiguous relationship - Dim Vendor filtering Fact Sales Invoice Line. This can take either a direct path or a circuitous route from Fact Purchase Order through a bidirectional relationship to Fact Sales Order through another bidirectional relationship to Fact Sales Invoice to Fact Sales Invoice Line. Even if you resolve this ambiguity, I think you’ll be playing a continuous game of whack a mole, and never be 100% sure that you resolved all the potentially ambiguous paths, and thus will not be fully able to trust the DAX results you get.

  • Brian

I have resolved this circular relationship by utilizing Vendor ID on the Purchase Lines.

GAI Data Model v1.3.pdf (199.4 KB)

As far as I can tell, circular references are ambiguous relationships and vice versa. I have already read this article - every article of this type seems to be warning against connecting dimensions this way. I’m not connecting my dimensions - I’m only connecting specific fact tables.

Take a look at the updated diagram above. A couple key things to note:

  1. No filters propogate outward from the Fact Lines tables
  2. No filters propogate into any dimension table except Items, which is a very simple relationship
  3. There are no many:many relationships at all
  4. There are no circular paths
  5. The only time bidirectional relationships are used, they are all within the Fact Header tables, which are effectively in the same layer of the waterfall. No circular relationships are formed because each Dimension is filtering a strategic layer of the waterfall.

As I understand it, this means no matter which fact table I’m examining, I should be able to propagate the ID to other fact tables and look up their header and line data.

Great resource. I have their “definitive guide to DAX” on my desk beside me. Again, they always discourage circular relationships (ambiguity), which I do not believe I have in my model. I think I’ve found a use case for bidirectional relationships that doesn’t need any circularity.

This doesn’t seem to have a video, just a download file…

Here’s a diagram showing filter layers. This, to me, is the most useful visualization of my data model so far. It shows the different filter groups.

GAI Data Model Filter Propagation.pdf (65.6 KB)

I think as long as I follow the two rules below, I shouldn’t have any ambiguity.

  1. When adding a header dimension, it can only be connected to the Sales Order Header.
  2. No header dimension may connect to a line, and no line dimension may connect to a header.

I’ve got a textbook on my desk called “The Definitive Guide to DAX” by Marco Russo and Alberto Ferrari. It’s got about 700 pages, 3-4 of which talk about bidirectional relationship, again only mentioning the use case for syncing slicers. Am I forging new ground here? I can’t find anyone else using these relationships like I am.

@CStaich,

A relationship is ambiguous when there are multiple paths between tables. A circular reference is when one table references a second table, which in turn references the first table. Power BI treats these conditions differently in terms of the presence and content of error messages, but I get where you’re coming from re: your discussion of your model.

> This doesn’t seem to have a video, just a download file…

Yes, @sam.mckay’s Showcase files are sample reports. At times, he does reference particular showcases in videos, but the Showcase section of the Enterprise DNA portal is the reports only.

I think as long as I follow the two rules below, I shouldn’t have any ambiguity.

Would be interesting to test whether turning on the inactive date relationship(s) creates any problems related to unexpected/unpredictable filtering of other fact tables connected via the bidirectional relationships to the target table.

> Am I forging new ground here? I can’t find anyone else using these relationships like I am.

I tend to stick to pretty vanilla star schema data model structures in my reports, so I have never seen or used a model quite like the one you proposed above. When faced with similar problems, I’ve taken the more traditional route of denormalized fact tables, and the use of bridge tables and/or virtual relationships (via TREATAS) to solve the resulting many-to-many issue. Could be that you’ve come up with something unique, or that those who tried it previously didn’t survive the explosion…:wink:

You are raising a lot of interesting issues.

  • Brian

I have that same book on my desk. I use it as reference.

This article was written by one of them and also linked above. It’s a great explanation as to why not to use bidirectional relationships.

This is a really epic thread. Nice work everyone. Especially Brian providing a lot of good insights here.

There’s a bit to this model, but I would have today by looking at the last image I think your pretty close to getting this relatively optimised.

The only suggestions I would potentially have is to see if there is any way to consolidate you invoice line to invoice header table somehow. And same for other with similar name. This would simplify your model immensely and is probably what I would do if this was me working through this.

You would obviously then have multiple line per invoice with a lot of over lapping data, so really it’s up to you if you want to do this.

Overall I can see you’ve thought long and hard about this and think you’ve got a good handle on what works best for your data.

Chs
Sam

2 Likes

I also agree with using TREATAS instead of many to many relationships. It’s much easier in my opinion to keep you model simpler and then solving for it with a simple formula using CALCULATE and TREATAS.

Sam

1 Like

As far as I can tell, I no longer have either of these.

Each individual base measure will reference the relevant date for that calculation. Within each base measure, there shouldn’t be ambiguity. When I do measure branching and begin to combine these base measures, I’m not sure what will happen! I’m guessing I’ll need lots of USERELATIONSHIP('Dim Dates'[Date], [column]) and lots of distinct base measures.

With that in mind, this model might become cumbersome to upkeep if I need to specify the active date relationship every time I build a measure. I’m going to go review the videos on measure branching and context again.

https://portal.enterprisedna.co/courses/195681/lectures/2989725
https://portal.enterprisedna.co/courses/108877/lectures/13348694
https://portal.enterprisedna.co/courses/108877/lectures/13348691
https://portal.enterprisedna.co/courses/157239/lectures/2348654
https://portal.enterprisedna.co/courses/157239/lectures/2348653

I think the measures may end up being unnecessarily complex. Now I need to find a balance between the model I have vs. the model with the simplest DAX upkeep.

I’ve read this guide, and it doesn’t seem to address fact-fact relationships. I am not trying to sync slicers here, I have a practical structural reason to connect fact tables together.

I’m going to review these trainings shortly. My next move is to try to find middle ground between my current model and getting the simplest DAX.

Again, I’m really trying to avoid many:many relationships, and have opted to keep my header and lines tables separate for this reason.

If I were to combine header and lines tables, I would absolutely need to create circular relationships.

Look at the diagram below.

GAI Data Model Filter Propagation.pdf (65.6 KB)

The distinction between header fact tables and line fact tables is the only thing keeping my line dimensions from creating circular relationships.

i.e. if I combine header and line, every single line dimension table (such as Vendor, Detail_Contract, and Item) creates circular relationships with every single fact table.

Dim Item (1:*) -> Fact Purchase_Order (*:*) <-> Fact Sales_Order
Dim Item (1:*) -> Fact Sales_Order

Dim Detail_Contract (1:*) -> Fact Purchase_Order (*:*) <-> Fact Sales_Order
Dim Detail_Contract (1:*) -> Fact Sales_Order

That little arrow pointing from [fact header table group] → [fact line table group] means the filters on my line dimensions never propagate upstream to the header tables, keeping circular relationships at bay.

Barring removal of the bidirectional relationships currently present between my fact header tables, it is impossible to combine headers and lines. Plus, who wants many:many relationships if they can be avoided?

[Edit: Here’s a really interesting link to ‘normalization’ and ‘normal forms’ of a data model. I may have to buy this book!: https://en.wikipedia.org/wiki/Database_normalization#Normal_forms ]

@CStaich,

It’s really a “pick your poison” situation. You’ve effectively dealt with it through the use of bidirectional relationships. Personally, I would cast my lot with the many-to-many relationships, and deal with them through bridge tables and TREATAS, just because I’m more comfortable with that structure and approach. However, the decision ultimately comes down to what structure: a) best serves the questions you want to answer; b) simplifies your analysis; and c) makes the results easiest to interpret. Only you can make that call, and I definitely tip my hat to the hard work and great thought you’ve put into this.

Edit: Here’s a really interesting link to ‘normalization’ and ‘normal forms’ of a data model. I may have to buy this book!: https://en.wikipedia.org/wiki/Database_normalization#Normal_forms ]

This is really interesting. When I took my first data modeling class back in grad school, higher order normalization was a huge deal because processors were really slow and space was really expensive. However, when I took the SQLBI data modeling course last year, Marco Russo hammered home the point that Power BI and DAX are optimized for star schema, and if you have to do some level of denormalization to get there, that’s typically fine.

Good luck with your project. Please keep us posted as to your final model and how it works out.

Thanks - I’ve really enjoyed working with you on this one.

– Brian

1 Like

@CStaich did your latest model diagram meet your needs or did you wind up modifying at a later point in time?