I’ve done some thoughtwork and some whiteboarding and here’s what I arrived at. I think @mickeydjw had a great suggestion with the bidirectional relationships. As I don’t have a ton of experience data modeling, I hadn’t considered using these.
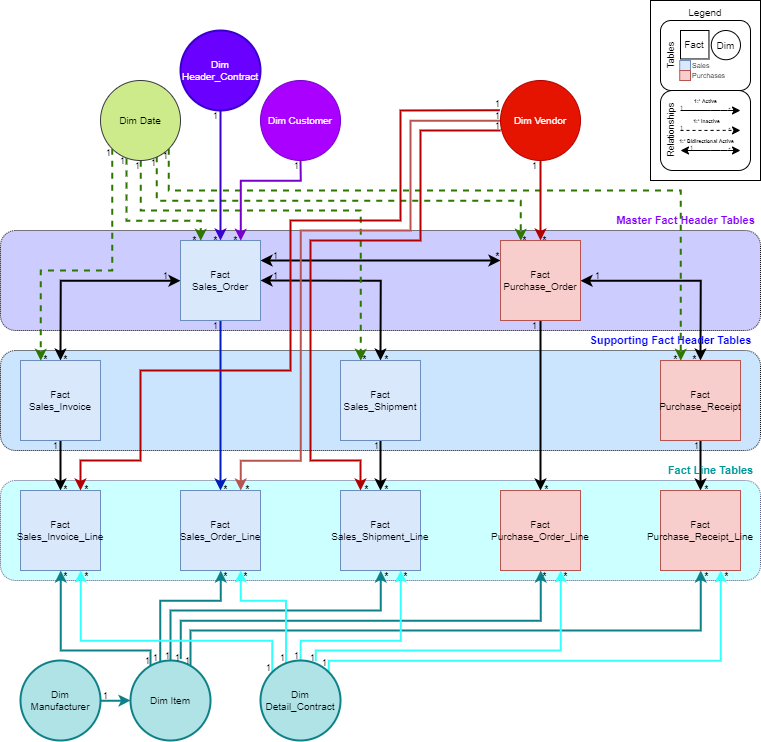
It seems to me that every time I am advised against using bidirectional relationships, the example shows two dimensions connected. The caution is that bidirectional relationships cause dimensions to filter each other down. In this diagram, the only bidirectional relationships are between my fact tables. (Master and Supporting Fact Headers). I think I am safe to connect the tables this way, and this may be a case where bidirectional relationships truly shine.
E.g. if I select a Sales_Shipment Header, I do want my other fact tables to be filtered.
I am still avoiding many:many relationships, and have opted to leave my header and lines tables separate.
Now, I have identified one specific circular relationship in the model. I am not entirely sure how this will come into play, but I have a feeling it is inconsequential.
Vendor -> Sales Order Line
Vendor -> Purchase Order -> Sales Order -> Sales Order Line
I suppose I may be able to change how the Vendor dimension connects, and instead of attaching it to the Purch. Order header, I could attach it to both Purch. Order lines and Purch. Receipt lines like I do for the Sales side.
I think this is the only circular relationship!
I have not thrown this into PBI yet, so I will likely return with the realization that something else is wrong. Stand by!
You are clearly putting in some great thought on this data modeling effort. However, before you go down the path of multiple (or any) bidirectional relationships, I would urge you to read this article carefully:
The absence of circular references doesn’t at all mean that you’re home free. As the article discusses in detail, ambiguous relationships are potentially even more dangerous, since they won’t necessarily throw an error message, but can produce nonsense results, or worse - incorrect results that aren’t obviously nonsense.
I can already see one ambiguous relationship - Dim Vendor filtering Fact Sales Invoice Line. This can take either a direct path or a circuitous route from Fact Purchase Order through a bidirectional relationship to Fact Sales Order through another bidirectional relationship to Fact Sales Invoice to Fact Sales Invoice Line. Even if you resolve this ambiguity, I think you’ll be playing a continuous game of whack a mole, and never be 100% sure that you resolved all the potentially ambiguous paths, and thus will not be fully able to trust the DAX results you get.
As far as I can tell, circular references are ambiguous relationships and vice versa. I have already read this article - every article of this type seems to be warning against connecting dimensions this way. I’m not connecting my dimensions - I’m only connecting specific fact tables.
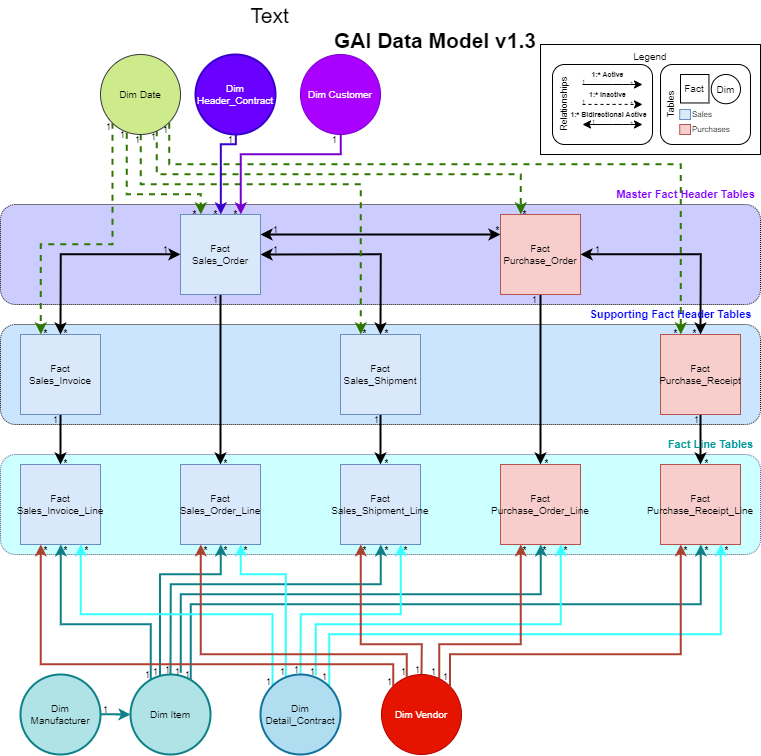
Take a look at the updated diagram above. A couple key things to note:
No filters propogate outward from the Fact Lines tables
No filters propogate into any dimension table except Items, which is a very simple relationship
There are no many:many relationships at all
There are no circular paths
The only time bidirectional relationships are used, they are all within the Fact Header tables, which are effectively in the same layer of the waterfall. No circular relationships are formed because each Dimension is filtering a strategic layer of the waterfall.
As I understand it, this means no matter which fact table I’m examining, I should be able to propagate the ID to other fact tables and look up their header and line data.
Great resource. I have their “definitive guide to DAX” on my desk beside me. Again, they always discourage circular relationships (ambiguity), which I do not believe I have in my model. I think I’ve found a use case for bidirectional relationships that doesn’t need any circularity.
This doesn’t seem to have a video, just a download file…
I think as long as I follow the two rules below, I shouldn’t have any ambiguity.
When adding a header dimension, it can only be connected to the Sales Order Header.
No header dimension may connect to a line, and no line dimension may connect to a header.
I’ve got a textbook on my desk called “The Definitive Guide to DAX” by Marco Russo and Alberto Ferrari. It’s got about 700 pages, 3-4 of which talk about bidirectional relationship, again only mentioning the use case for syncing slicers. Am I forging new ground here? I can’t find anyone else using these relationships like I am.
A relationship is ambiguous when there are multiple paths between tables. A circular reference is when one table references a second table, which in turn references the first table. Power BI treats these conditions differently in terms of the presence and content of error messages, but I get where you’re coming from re: your discussion of your model.
> This doesn’t seem to have a video, just a download file…
Yes, @sam.mckay’s Showcase files are sample reports. At times, he does reference particular showcases in videos, but the Showcase section of the Enterprise DNA portal is the reports only.
I think as long as I follow the two rules below, I shouldn’t have any ambiguity.
Would be interesting to test whether turning on the inactive date relationship(s) creates any problems related to unexpected/unpredictable filtering of other fact tables connected via the bidirectional relationships to the target table.
> Am I forging new ground here? I can’t find anyone else using these relationships like I am.
I tend to stick to pretty vanilla star schema data model structures in my reports, so I have never seen or used a model quite like the one you proposed above. When faced with similar problems, I’ve taken the more traditional route of denormalized fact tables, and the use of bridge tables and/or virtual relationships (via TREATAS) to solve the resulting many-to-many issue. Could be that you’ve come up with something unique, or that those who tried it previously didn’t survive the explosion…
This is a really epic thread. Nice work everyone. Especially Brian providing a lot of good insights here.
There’s a bit to this model, but I would have today by looking at the last image I think your pretty close to getting this relatively optimised.
The only suggestions I would potentially have is to see if there is any way to consolidate you invoice line to invoice header table somehow. And same for other with similar name. This would simplify your model immensely and is probably what I would do if this was me working through this.
You would obviously then have multiple line per invoice with a lot of over lapping data, so really it’s up to you if you want to do this.
Overall I can see you’ve thought long and hard about this and think you’ve got a good handle on what works best for your data.
I also agree with using TREATAS instead of many to many relationships. It’s much easier in my opinion to keep you model simpler and then solving for it with a simple formula using CALCULATE and TREATAS.
As far as I can tell, I no longer have either of these.
Each individual base measure will reference the relevant date for that calculation. Within each base measure, there shouldn’t be ambiguity. When I do measure branching and begin to combine these base measures, I’m not sure what will happen! I’m guessing I’ll need lots of USERELATIONSHIP('Dim Dates'[Date], [column]) and lots of distinct base measures.
With that in mind, this model might become cumbersome to upkeep if I need to specify the active date relationship every time I build a measure. I’m going to go review the videos on measure branching and context again.
I think the measures may end up being unnecessarily complex. Now I need to find a balance between the model I have vs. the model with the simplest DAX upkeep.
I’ve read this guide, and it doesn’t seem to address fact-fact relationships. I am not trying to sync slicers here, I have a practical structural reason to connect fact tables together.
I’m going to review these trainings shortly. My next move is to try to find middle ground between my current model and getting the simplest DAX.
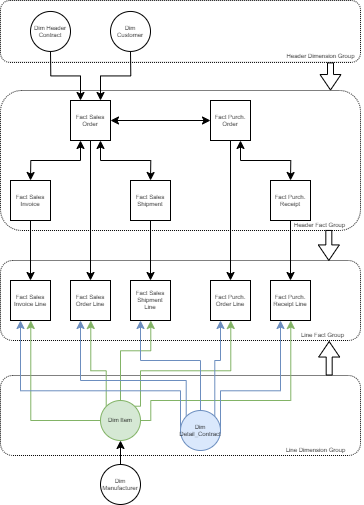
The distinction between header fact tables and line fact tables is the only thing keeping my line dimensions from creating circular relationships.
i.e. if I combine header and line, every single line dimension table (such as Vendor, Detail_Contract, and Item) creates circular relationships with every single fact table.
Dim Item (1:*) -> Fact Purchase_Order (*:*) <-> Fact Sales_Order
Dim Item (1:*) -> Fact Sales_Order

Dim Detail_Contract (1:*) -> Fact Purchase_Order (*:*) <-> Fact Sales_Order
Dim Detail_Contract (1:*) -> Fact Sales_Order
That little arrow pointing from [fact header table group] → [fact line table group] means the filters on my line dimensions never propagate upstream to the header tables, keeping circular relationships at bay.
Barring removal of the bidirectional relationships currently present between my fact header tables, it is impossible to combine headers and lines. Plus, who wants many:many relationships if they can be avoided?
It’s really a “pick your poison” situation. You’ve effectively dealt with it through the use of bidirectional relationships. Personally, I would cast my lot with the many-to-many relationships, and deal with them through bridge tables and TREATAS, just because I’m more comfortable with that structure and approach. However, the decision ultimately comes down to what structure: a) best serves the questions you want to answer; b) simplifies your analysis; and c) makes the results easiest to interpret. Only you can make that call, and I definitely tip my hat to the hard work and great thought you’ve put into this.
This is really interesting. When I took my first data modeling class back in grad school, higher order normalization was a huge deal because processors were really slow and space was really expensive. However, when I took the SQLBI data modeling course last year, Marco Russo hammered home the point that Power BI and DAX are optimized for star schema, and if you have to do some level of denormalization to get there, that’s typically fine.
Good luck with your project. Please keep us posted as to your final model and how it works out.
Thanks - I’ve really enjoyed working with you on this one.
This model has carried us for quite a while.
The data has grown in size and scope significantly (100+ tables, couple dozen dataflows, several sources). Some lessons learned along the way:
I decided to leave all date relationships inactive. There are lots of them for different contexts, but leaving all inactive as a rule means there’s never any ambiguity - base measures break if you use the standard ‘Dim Dates’[Date] and don’t specify what date you want to use somewhere in the measure. One convenient date table acts as a governor. Throw this in your base measures, and branch using time as one of the main constructs: USERELATIONSHIP(‘Dim Dates’[Date], )
Activating specific base measures in different context works great. Activating more than one date relationship can cause really positive effects if well done, and really confusing effects if not.
In financial reporting, you often need to account for different transaction types together in a combined summary. Each base measure, say ‘Total Receivables’ and ‘Total Payables’ has a different date relationship to activate, and a number of different measures to branch from there. Works great.
If you’re just presenting raw tables that your users are going to export, use calculated columns and crunch the data during your refresh. Complicated context tends to break big tables in a big number of ways.
In terms of performance, balancing timings with Dataflows without creating a ‘Computed Entity’ and requiring Premium was a challenge. At a certain size and scope, it makes a lot of sense to start building more scalable systems that can be billed/GB. We’ve managed to keep this basically free until recently by using Pro to its fullest capacity.
The path we are pursuing would looks something like - Fabric to ingest raw data into Data Lake, use Dataflows to pre-compute summaries and store them in Datamarts, and trying to expand on the monolithic ‘Master’ model idea that’s beginning to reach the limits of Pro and Dataflows. Still learning, but Synapse may be part of the stack.
Seems obvious in retrospect, but working with optimization and performance measurement tools along the way should be a daily practice, and I should have seen some of the bottlenecks coming. The more you can do in compute, the less you have to do in RAM at run-time.
My take on this is quite different, I would have modelled it with 5 Fact tables, like this:
Fact Sales Order Header, Fact Sales Invoice Header & Fact Sales Invoice Line
Fact Sales Order Header & Fact Sales Order Line
Fact Sales Order Header, Fact Sales Shipment Header & Fact Sales Shipment Line
Fact Sales Order Header, Fact Purchase Order Header & Fact Purchase Order Line
Fact Sales Order Header, Fact Purchase Order Header, Fact Purchase Receipt Header & Fact Purchase Receipt Line
Yes, there are duplicate data but it can only become a performance issue, not a logical/business one for the following reason: you’re never supposed to link Fact tables directly and always go through Dimension tables.
My reference on this is Ralph Kimball’s book: The Data Warehouse Toolkit
Also, I don’t see the issue with bi-directionnal links (as long as you’re strictly staying with star-schema). So if anyone want to enlighten me as to why it’s bad I’d appreciate it.
I do note, though, that you’re going with all Date tables as inactive relationships. That is the same idea I was going for with my current issue, so it’s reassuring to see it can be done.