Hi Forum,
I work in revenue management (hotel & conferences) and have been tasked with doing an occupancy report for a conference center. I have terrible source data from Qlik (all manual Excel extracts) generated from a 2009 version of MS Dynamics (the venue’s booking system). I’ve found it extremely hard to work with and feel there’s probably a better way to come at this challenge in BI so I can avoid falling back on Excel. Hoping someone here can help me understand what I’m doing wrong.
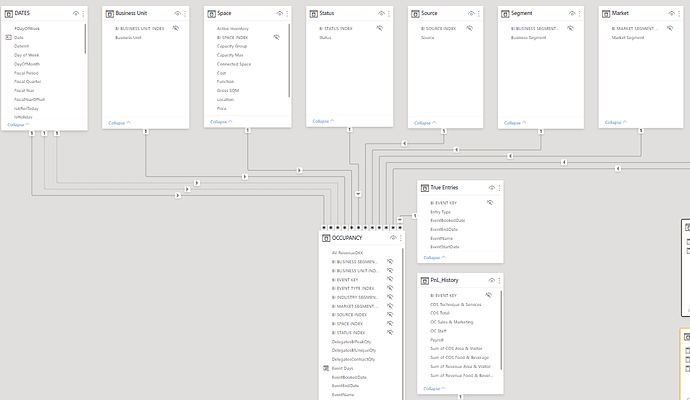
The attached pbix file is a reduced version of the full report but the model is essentially what I want it to look like. I am using keys in conditional columns to link up shoddy data and “clean” them through my dimension tables. “Space”, “Source” and “Industry” dimension tables are just 3 of 12 dimension tables in the original report which are meant to do the job.
Some of the KPI’s I want to show over time intervals are:
- Occupancy % (event days within a date period)
- Square meter utilization
- Revenue per space/square meter
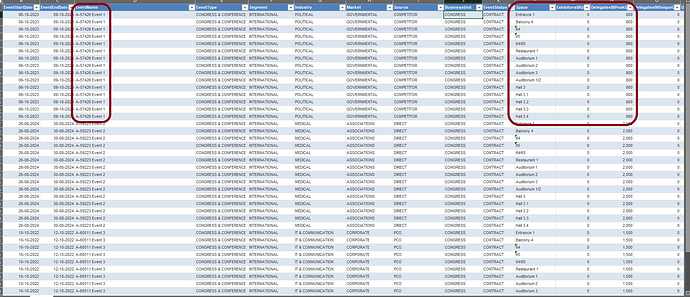
Here is an example (see screen dump) of some of the source data. Each row represents a space booked but all of the numerical inputs (eg. rental revenue, gross sqm, delegates etc.) show the total for entire booking. For example, a small conference room for 12 people will have a total attendee number of 800 persons and rental revenue of $800.000 because it is part of a larger event in the conference center, and so on. So I am pretty limited in what I can show since these numbers have obviously not been maintained. Basically, the only unique value in each row can be found in the “Space” column.
I have found many of Sam’s older instructional videos helpful and tried to emulate them in the report, incl. playing around with come calculated columns, but I don’t seem to be getting it right. I am sure someone more versed in BI knows there’s an easy fix for this and I will be so grateful for any help you can provide. Thanks!
Oscar
Occupancy_v1.pbix (1.0 MB)
1 Like
Hi Oscar,
Hope you’re well!
You might need to be more specific in what you’re asking as the broadness of your question makes me feel like you’re asking the forum to build your whole report which feels more like a piece of consulting.
Regards
David
1 Like
Hi David,
Thanks for your reply. You’re right I should have been more specific. I posted at the end of my workday and was a bit tired. I apologise. Of course I’m not asking anyone to do my report for me. This is a DAX proficiency issue (or lack thereof) and I am in need of some pointers to know if I’m going in the right direction.
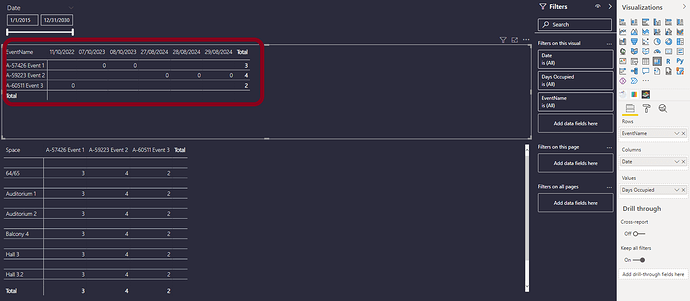
Here is a specific example drawing from the “Calculate The Occupancy Days Per Month In Power BI Using DAX” tutorial on eDNA. Can you tell me why there are no values represented for each event but the totals are there?
1 Like
Hi @oscar_wandel
I do not know why the measure “Days occupied” is only giving the total, and not values on the individual dates. In the model there are two inactive relationships with Date and EventEndDate and EventStartDate; when making one of them active, still only the totals come out of the measure, and the individual dates disappear. The measure “Days occupied” is very complex with all the nested IF and AND conditions.
I recommend to use an alternative :
PBIX attached:
Occupancy_v15.pbix (1.0 MB)
-
create an active connection between Dates and EventStartDate in the data model
-
create a measure with calculation of the duration in days, based upon a summarized virtual table.
Adjusted Days Occupied =
var SummarizedEvents = ADDCOLUMNS(
                          SUMMARIZE( EVENTS, EVENTS[EventName], EVENTS[EventStartDate], EVENTS[EventEndDate] ),
                                    "EvenementC", COUNTA( EVENTS[EventName]))
Var EventDuration = SUMX( SummarizedEvents, INT(EVENTS[EventEndDate] - EVENTS[EventStartDate]  ))
return EventDuration
-
Explanation of the measure : the virtual table in the measure is needed to aggregate multiple Events-rows for one event into one, in order to avoid double counting of the duration.
-
It would be recommended to obtain an Event-table with single event-lines, when no information is lost.
-
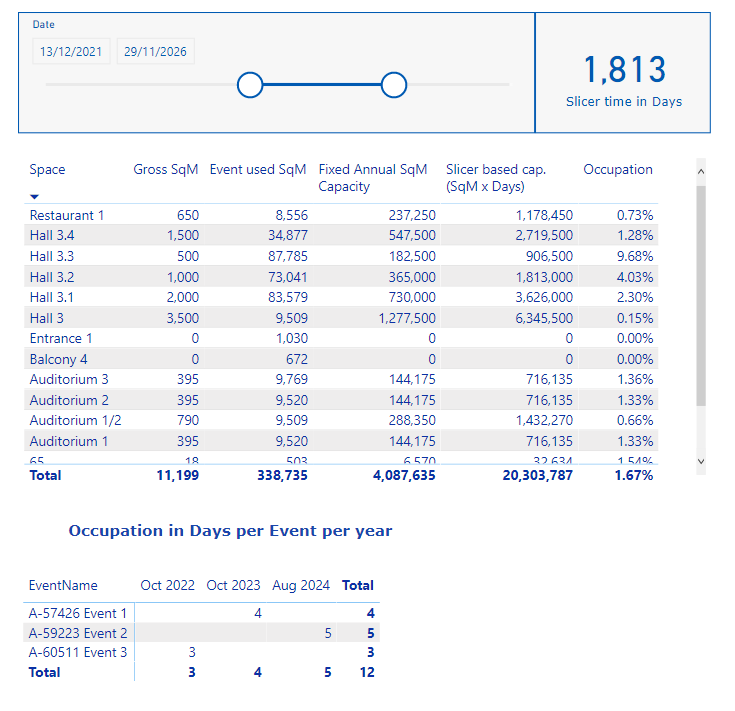
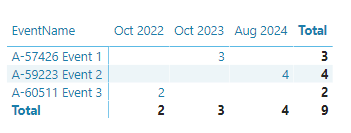
A possible report looks as follows:
-
I am not sure why the duration should not be one day more: event A-57426 Event1 starts 6 Oct 2023, ends 9 Oct 2023, which is in total 4 days, in the original example report 3 days were reported.
I hope it will help you further, if you have further questions or remarks, please let me know.
kind regards, JW
3 Likes
Hi @deltaselect,
Thanks so much for taking the time to respond! I will go over it this evening and probably have questions since this is above my DAX knowledge, but I really appreciate your help.
To your last point, you are absolutely right. I’m tempted to just do a “return EventDuration + 1” since it’s a failure to count the EventStartDate as I see it.
BR,
Oscar
1 Like
Hi @oscar_wandel,
Just IF you want to include the starting day of an event into the Duration, the way to do this is type “+1” in the last part of the measure (see below, and better NOT after “return EventDuration”, as this gives errors in the calculation) :
Var EventDuration = SUMX( SummarizedEvents, INT(EVENTS[EventEndDate] - EVENTS[EventStartDate] + 1 ))
With the +1 implemented, the duration of the example A-57426 Event1 will become 4 days.
If you have further questions, please let me know.
Kind regards, JW
2 Likes
Hi @deltaselect,
Thanks again for helping me with this. This DAX pattern is a little over my head and I’m not sure I understand it. In terms of repurposing the same pattern for other metrics, is it feasible to apply this to square meter utilisation? What I really want to get at is a sqm occupancy measure. So the total number of contracted square meters (“EVENTS[GrossContractedSqm]”) for each meeting space in the dimensions table “Space”.
I do have an events table where each booking is represented and linked to the data table through the “BI EVENT KEY”. Also a historical PnL table for prior events linked the same way.
I really appreciate your time and help and completely understand if the above question is too much. Any pointers you have are greatly appreciated.
Thanks again!
Oscar
Hi @oscar_wandel ,
Your request is easy to realize (and obvious).
A possible workout looks as follows, based upon your provided sample data previously :
(see also attached PBIX :
Occupancy_v18.pbix (1.0 MB)
-
adding a calculated column in the Events-table, calculating the SqM capacity, defined as GrossContractedSqm x Duration
Used Sqm Event = (INT(EVENTS[EventEndDate] - EVENTS[EventStartDate] +1) *
EVENTS[GrossContractSqm])
-
Notes to ad 1) :
- Possible double counting of duration in the calculation above, as the definition of “GrossContractSqm” is unknown for me.
- There is presumably a good business reason why [ Duration x SqM per Space] is not used as capacity usage per event.
-
Optional is an additional calculated column in table “Space” with annual capacity per year.
Annual SqM Capacity = 365 * Space[Gross SQM]
-
A measure group "DS Measures is set up containing the following measures:
-
three basic measures of the sum of (calculated) columns, “Event used SqM”, “Fixed Annual SqM Capacity” and “Gross SqM”
-
an occupation rate, defined as contracted SqM x duration / Capacity (SqM * days) based upon a variable time frame.
Occupation = DIVIDE([Event used SqM] , [Slicer based cap. (SqM x Days)], 0)
This results in a basic report as shown below:
I hope that it helps you further and my interpretation of capacity is correct.
If you have further questions or remarks, please let me know.
Kind regards, JW
3 Likes
Wow! This is more than I expected. Thank you very very much, @deltaselect! I clearly need to up my DAX skills.
If you are ever going to Copenhagen for a getaway and I can be of assistance, please let me know (oscarwandel at gmail dot com). I would very much like to repay your kindness. Thank you again, I really appreciate your help.
3 Likes
Great to hear that you are having progress with your query @oscar_wandel , kindly mark the answer that solved your problem so that other users can benefit from it as well.
Please take time to answer the Enterprise DNA Forum User Experience Survey, we hope you’ll give your insights on how we can further improve the Support forum.
Thank you so much 
2 Likes
