Nulls/Blanks DAX Measure

Hi,

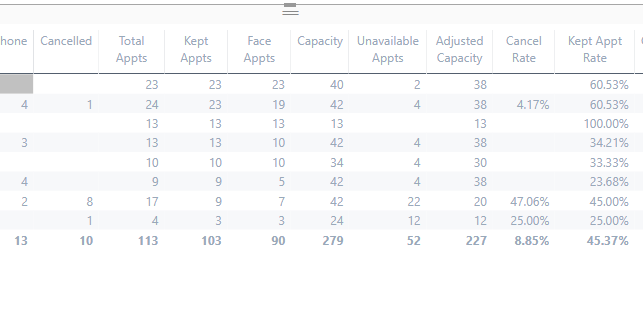
I have written a DAX measure that calculates the cancelled appointments and it works well.

Cancelled = CALCULATE([All Adviser Cancelled Appts],
                        FILTER('Access Active Advisers',
                               'Access Active Advisers'[Access Level]="Active"))

image

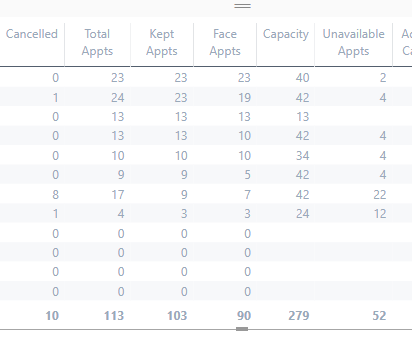
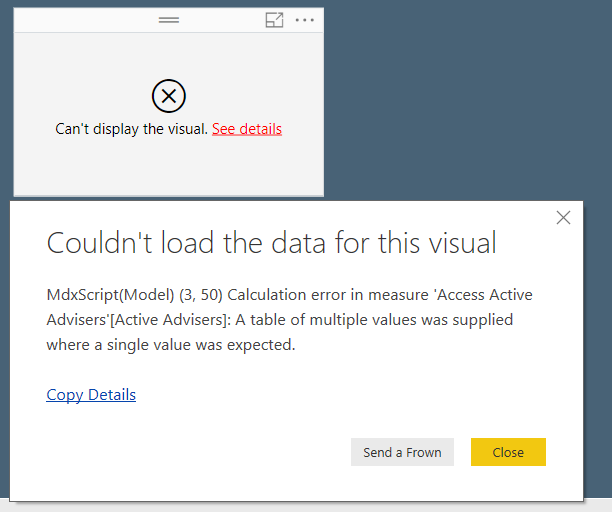
I then modified the DAX measure to show 0 where there are blanks, however it shows all results and the ‘Active’ filter no longer applies?

Cancelled = 

Var CancelledAppts = CALCULATE([All Adviser Cancelled Appts],
       FILTER('Access Active Advisers','Access Active Advisers'[Access Level]="Active"))

Return
    IF(
        NOT ISBLANK(CancelledAppts),CancelledAppts,0
    )

image

Just needing to understand why this does not work and how to resolve it?

Thanks in advance

It seems to be calculating as it should to me.

Can you pinpoint where the issue is? Like a specific number…

I’m looking at the below table and all the results are the same, it’s just that the zeros show up now…as per the formula.

What are you expecting to be different?

Hi Sam,

The filter applied is only for Active users, however the results in the 2nd screenshot shows inactive users as well (The last 4 entries).

Anyone who has total appts as 0 is an inactive user.

Currently what is showing in the table is what your asking it to with the IF logic. This logic is basically ignoring the filter within the CALCULATE function as that only applies to that particular measure.

Do you want the inactive users to be blank? If so, aren’t they already blank in the initial table?

I’m just not getting what you need here. What values are you trying to get as the last four values if not blank or zero?

Hi Sam,

Thank you for your response.

Hopefully this screenshot can shed some light on what I am after.

I only want the active rows to be displayed. Currently it is showing both.

image

Thanks

I’m still confused as isn’t the first table you copied into this forum post already only showing the ‘Active’ ones from what I can see.

If you don’t want to show a particular row/results then you need to make the result BLANK() not zero.

Hi Sam,

i’ve still been working on this and have taken on board what you have mentioned.

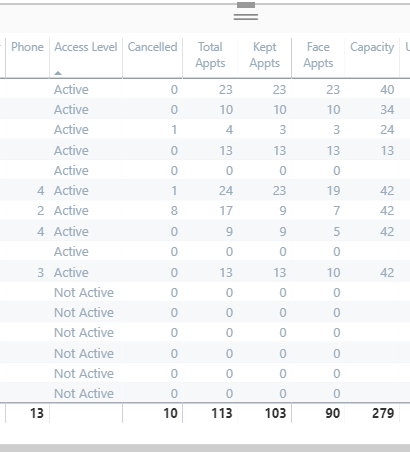
A quick question, am i able to add 0 and not show them based on the access level? (i.e-active/inactive)

The reason i ask this is because we measure our staff based on revenue added to the portfolio and in the event nothing was added, i would like to show a 0 instead of a blank.

Alternatively is there another method of extracting a column based on another column?

image

in the above screenshot, it like obtain a list of all advisers that are active only.

Your tutorial video “Grouping & Segmenting Your Data With DAX Measure Logic - Advanced DAX” showcases this by creating another table.

Is there a way to obtain this without creating another table?

Thanks in advance

Regarding the new table for just active advisors…you certainly can do this.

You can do it a couple of ways, but I think this is probably the easiest by using CALCULATETABLE

Syntax below.

CALCULATETABLE( VALUES( Advisor Column ), Department = "Active" )

This should do it. Doesn’t need to be any more complicated than this I don’t think.

I think on the zeros vs blanks.

I believe you really want to solve this with filters on your report page.

So place a slicer on your report and allow the user to filter by active or inactive.

Then you can use the zero instead of blank, but then the user can decide what they want to look at.

Would this work?

Hi Sam,

You are right, the immediate supervisor requires to see both and I will be adding a slicer to accommodate this (As in the first table of the post).

Senior management have advised that they would only like to see active staff which relates to my question of building the table.

I attempted to follow your code but seem to be having an error.

Active Advisers = CALCULATETABLE(VALUES('Access Active Advisers'[Adviser]), 
                                     ' Access Active Advisers'[Access Level]="Active")

Thanks

Ok so that formula can not be used like you’re using it. When you said create a table I thought you meant actually create a physical table using the ‘table’ feature.

I think there is some learning to do around scalar functions and table functions.

Have you been through the mastering DAX course yet? Please do if not

If you wanted a table of just active like you image, then I wouldn’t complicate it. Use visual or report level filters to achieve that. You don’t need DAX functions for this specific purpose.

I detail this here

Thanks for the feedback Sam.

I haven’t reached that module yet but i will complete this week and come back back to the forum if i have any further questions.

Ok great, good luck