Im trying to calculate new customer wins. I went through the customer related solutions but they are not similar to my logic. Below is the image with the flow for the logic.
and below is the example.
I am able to achieve this, however it takes a long time to load result. to me the DAX I have written are simple and it shouldn’t take a long time, however i’m not sure if there is an efficient way to achieve this, really really looking for help. If its one month data it doesnt take a long time, when it comes to one year data it takes time.
Below are the fields I created in Sales Table.
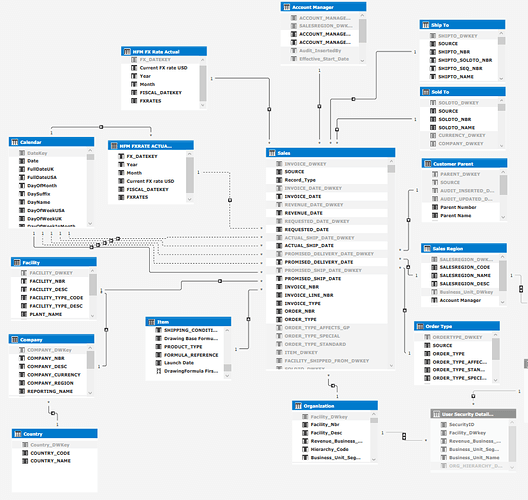
This is the data model:
and example screenshot
Below are the steps I did and achieved the calculation, but it takes long time in returning result, record count for SALES table is only 4 million. Although memory issue is there, but i really need help to know if there is a better way to do this.
The reason I created the measures separately is that we should be able to see the time frames dates if needed.
-
I created combined calculated column for customer number and drawing formula.
-
created measure for time frame 1:
TF1 Date:=
VAR startdate =DATE(YEAR(STARTOFMONTH(‘Calendar’[Date]))-1,MONTH(STARTOFMONTH(‘Calendar’[Date])),DAY(STARTOFMONTH(‘Calendar’[Date])))
VAR enddate = ENDOFMONTH(‘Calendar’[Date])VAR TF1Date2=CALCULATE(MIN(Sales[REVENUE_DATE]),ALLEXCEPT(Sales,Sales[Customer],Sales[Drawing Formula]),FILTER(Sales,Sales[REVENUE_DATE]))
RETURN TF1Date2
-
created measure for time frame 2 Start Date :
TF2 StartDate:=
VAR startdate =LOOKUPVALUE(‘Calendar’[LastDayOfMonth],‘Calendar’[Date],Sales[TF1 Date])
RETURN startdate -
created measure for time frame 2 End Date:
TF2 EndDate:=
VAR initialdate=Sales[TF2 StartDate]+1
VAR seconddate =LOOKUPVALUE(‘Calendar’[Last Year Date],‘Calendar’[Date],initialdate)
VAR enddate = LOOKUPVALUE(‘Calendar’[Last Year Date],‘Calendar’[Date],seconddate)
RETURN enddate -
Using timeframe 2 start date and end date from points 4 and 5, i created next measure timeframe 2 date:
TF2 Date:=
VAR startdate =Sales[TF2 EndDate]
VAR enddate = Sales[TF2 StartDate]
VAR TF2Date2 = CALCULATE(MIN(Sales[REVENUE_DATE]),DATESBETWEEN(‘Calendar’[DATE],startdate,enddate),ALLEXCEPT(Sales,Sales[Customer],Sales[Drawing Formula]))
RETURN TF2Date2 -
created measure to return end of month of Time frame 2 date:
TF2 EO EndDate:=
VAR initialdate=Sales[TF2 Date]
VAR seconddate =LOOKUPVALUE(‘Calendar’[LastDayOfMonth],‘Calendar’[Date],initialdate)
RETURN seconddate -
created measure to return the month difference
TF MonthCount:=
Var selectedendperiod = ENDOFMONTH(‘Calendar’[Date])
Var enddate = Sales[TF2 EO EndDate]
VAR MC1 =SUMX(
VALUES(Sales[CPDF]),
IF(OR(OR(enddate=blank(),enddate=selectedendperiod) , enddate > selectedendperiod),1,
DATEDIFF(enddate,selectedendperiod,MONTH)
)
)RETURN MC1
8.Created the new win check measure which returns 0 or 1
New Win:=
VAR new =
CALCULATE(
                    MINX(
                        SUMMARIZE(Sales,Sales[Drawing Formula],Sales[Customer],'Item'[ITEM_DESC]),
                        IF(Sales[Drawing Formula]=BLANK(), 0,
                           IF([TF MonthCount]<13,1,0))
                  )
)
RETURN new
- Finally return the sales for the new win customers
NewWin Sales:=SUMX(Sales,IF(sales[New Win]=0,0,Sales[SALES Revenue USD_FxAdj]))
Please help!


