Hi everyone!
I’m trying to determine if there is a way and/or if it would be beneficial to try and merge the columns I need onto my Master Item table by using DAX in a New Table or if I can only do what I am looking for by way of Query Editor? I also was not sure if M Coding can be used in the New Table capacity or if that is strictly within Advanced Editor.
For Example:
My Master Item table has columns of:
Item# // M1 // M2 // M3 // M4 // M5 // M6 // M7 // P1 // P2 // P3 // P4 // P5 // P6
Our SQL Server using a separate data table for each of those classifiers like:
M1 ID // M1 Description
and some have 1 extra column for a Value like:
M2 ID // M2 Description // M2 Value
Is there some way to use CrossJoin, NaturalInnerJoin, AddColumns, SelectColumns, Related, or other DAX to try and do with just through the NEW TABLE function? I am looking to avoid having Query Editor process through 13 Merges and 13 ExpandColumns on a table of over 1,000 Item #'s to put all of this data onto 1 simple table. I was starting to play around with CrossJoin but wasn’t sure if this was ideal. If CrossJoin works but leaves behind the original M1/P1 columns, can DAX be used to Remove those columns or can that only be done through Query Editor steps? (which wouldn’t be possible on the New Table function since those tables don’t appear in your Query Editor) Am I correct in all of these thoughts?
I do understand this isn’t the ideal way since I would be adding those columns of data down a large table versus leaving them separate, but I also have a rather complicated and diverse model due to are multiple tables on our SQL Server for a full supply chain company operating from raw material, to manufacturing, to distribution, sales, and also involving 3rd Party Logistics partners.
My reasoning for this is to have all potential SKU Classifications I would use for Item Sorting and Filtering in 1 location and not have to us 13 separate Tables for searching and dragging into reports and filters.
I’ve read through this a couple of times and struggling to visual everything here.
Is there a way to mock up maybe what you trying to do and show some images of what it looks like.
I personally would look to use the query editor for most combining and joining etc. The main reason is you don’t want to be bring multiple tables into your model and then joining after that with DAX formula. That’s highly inefficient and your model would be a mess.
There must be a way in the query editor to optimize this, but as I say I struggling on visualizing the scenario in my mind.
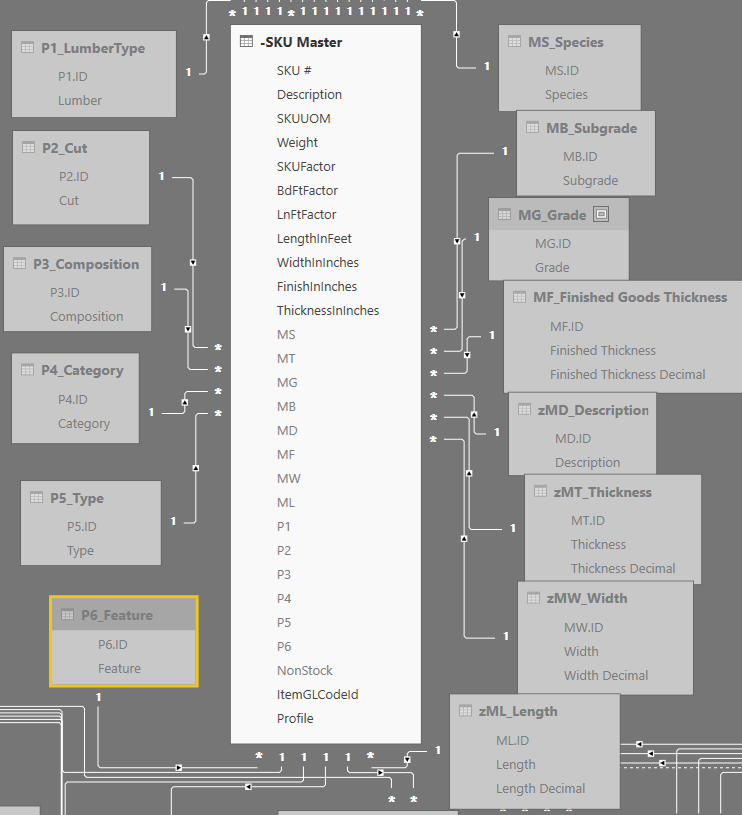
*ignore those “z” I forgot to remove from the start of some of those M Table names. I am using that for organizing my tables ordering to keep what I needed on a regular basis at the top.
I put together a snipit of all classification tables around the SKU Master table. I hope this helps to visualize it.
I have also determined yesterday that I may look to involve actual SQL Code into the SQL Statement Query part at the beginning of the Query to get the data and have the SQL coding replace the ID’s in the SKU Master with the Descriptions and Decimals from these classification tables.
I also need to work in some SQL coding like that with other results tables that could easily have a few joins, filters, and not include many columns I do not need from the official get data part. This should help relieve how taxing my refreshes are on the server. I now run into a lot of issues with my Scheduled Refreshes timing out and I believe it is due to all of the data pulling into the data model and taking a long time to run query steps and then getting rid of a chunk of the unneeded data anyways.
Only issue here, I do not know SQL…I’m checking out some Free SQL Code Producing websites, but if that isn’t sufficient I will end up having to request out IT Department to take time away from their many projects to help me get some coding done for these queries.
On first look my recommendation is to simplify this as much as possible. Certainly the best practices detailed within here is a good start.
Also, do you really need everyone of these individual tables as lookup tables. Maybe you can delete some of them (if you’re never going to use them) or integrate them into the main fact table.
Another big recommendation is look to stack the lookup table up the top and fact table/s down the bottom.
The model just look way to big and complicated to me. If would be trying to minimise the amount of table and relationships as much as possible. These is quite simply the reason why everything is running slow and timing out, there are just to many table and relationships (meta data) that Power BI is having to store in the one model, and I’m presuming the data file your working on is huge because of it.
Potential you don’t even need half of these lookup table. You may be able to just integrate the detail within the lookup into the fact table and get rid of the index etc. This would tidy things up.
I honestly think my tips are where you need to start first, and will go a long way to improving things here. I don’t really believe there’s any other way to bandage things up from how they look currently. It just needs massive simplification first of all.
Once this model is simplified I’m confident everything post that will be a lot easier.
**Just one other side note. Also have a good think about what you want in your report. Maybe if there is a huge amount of information and data to model it might be better to break them out into another model and work across a couple of reports. Anyway, another thing to think about.
Thank you Sam. I should have clarified that I moved the tables around the Master SKU table just for the purpose of sending that screen shot. Also my model doesn’t run slow once data is refreshed. The only slow issue is the BI Service Scheduled Refresh timing out. Part of me wonders if some of that has to do with our Server as well. I may need to ask that question too our IT just to see what they say about it.
Later I will paste what my full model looks like right now after a little more cleaning. I have gone through quite a few of your full training sections like the one you shared above. I have learned a lot and integrated a ton of your concepts into this model. This version came a long way from my first, but I know I still could use some improvement on simplifying it further.
Here is a question I hope you can answer: If I have a lot of tables being used as Staging Queries that Do Not Load into the model, do these all slow the scheduled refresh just as much as if they were loaded into the model?
Since that is likely what would be done with these classification tables having the needed information put directly onto the Master SKU table.
Ok got it now.
Great, seems like you know what to do from here.
Regarding the scheduled refresh, yes, the staging tables all would still update every time with that operation because they all still exist at the query level just not in the data model.
By using this technique you are though making your model far more efficient, so you file size should be much smaller and overall model faster to calculate etc.
It really depends on how big these lookup/staging table are. If they are small, I don’t feel that it should have a big impact, on the flip side if they are large then yes they would take some time to update each time.
I do think the servers can play a decent role in time to refresh, so that certainly would be something to investigate.
My recommendation is to merge the smaller lookup table into the master table.
One other thing I do with bigger models, is I actually start with only a few tables and then build up the model from there. By doing this you can see where things really start to slow down.
There is a tendency to just bring everything into the model and then work backwards, but I think the incremental build is a much better strategy. Start with the most important table, optimize and then add to it.
Chrs
Sam
Thankfully I did originally start with my primary tables and incrementally build up from there. Certainly is excellent advise!
I had multiple different BI models made up for different parts of the business, but integrating all of these within the company would be extremely confusing to the end users I will eventually put all of this in front of. Whether a blessing or a curse, the best solution I have narrowed down is to get every potential angle of the business into this 1 model since each previous version was housing many of the exact same tables anyways.
I figure I will make this model with some IT help providing me SQL queries to use at the initial Import and filter down the largest tables to just the past year or 2 for the purposes of production/manufacturing but will still provide almost any answer needed overall. This will be the model scheduled for multiple daily refreshes.
Then I’ll copy the model and remove the date filters to have a complete company historical model for use when needed but it just won’t be setup for so frequent of refreshes, maybe just once on a weekend so it doesn’t time out.
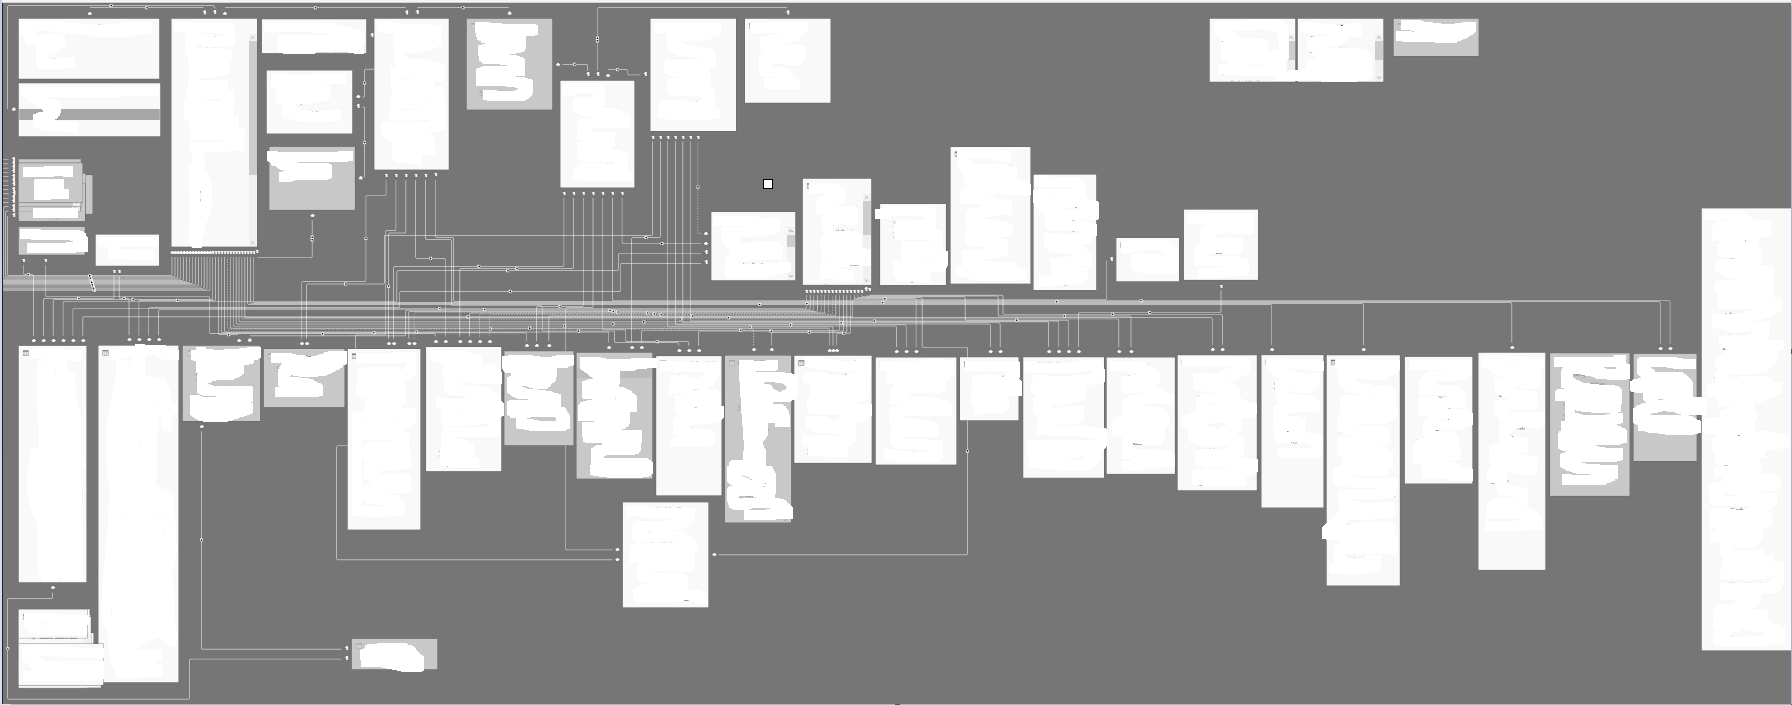
Here is the currently craziness of my model. Certain filtering situations are not 100% yet but I’m hopeful that finding a good way to combine some tables from the SQLStatement at original Query Import will help with this as well. I am 99% sure I finally have all of the tables needed for monitoring the entire business from production needs to every possible category filtering ability and sales reporting within this model.
I’m excited to be this close to a finished entire business model. It has been a slow road the last year to year and half of me learning BI and the business as it progressed towards all of this.
Nice…eventhough there’s a lot there, it does make sense with how you have laid it out.
Doing everything in a best practice way is crucial with models like this.
One thing for sure though, that due to the large amount of ‘meta data’ with all the tables, columns, and I presume measures, things are going to run slower here especially on the query side.
That’s just the way it is. Power BI can handle a lot but not endless amount of tables and column. This looks like it’s getting on the upper end in my experience.