New Student Versus Continuing Student Analysis

So I have been watching the videos created for “New Customer Analysis” and downloaded the sample PBIX file to follow the logic. I was able to create the formulas needed from the perspective of students in higher education versus customers as presented in the videos and demo file.

But a couple of things that are different for me and I may be missing the mark on include:

  • A student is considered new if they have gone a full 12 months without taking a course which means they have to reapply for admission. So I set up the Churn Time Frame to be based on 365 days. So Churn Time Frame = GENERATESERIES(0, 730, 21) because there is a way for a student to keep themselves active for 24 months by doing a future registration beyond the current date and Churn Time Frame Value = SELECTEDVALUE(‘Churn Time Frame’[Churn Time Frame], 365)

  • Because the term start date is one specific date in a month versus us having a date the student actually registered my version of the Sales table which would be a Registrations table does not exactly line up and the day of the month that a term will start is not always a perfect 30 days or 21 days after the previous term month. Each month of the year is a term month and terms last 3 months. My Date table is created based on my academic year structure. If I create formulas like All Students = COUNTROWS( ALL( ‘WW Registrations’[Student ID])) then I end up with a count of every single student across all 5 academic years so when I do a Continuing Student Formula (my version of your Steady Customer) formula the number just gets larger but without respect to the academic year which is what I want it to do. Introducing logic to make it respect academic year boundaries does not yield a usable result as it all becomes 0.

I think my problems boil down trying to translate the videos and logic you provided into logic that fits my model and unique scenario dealing with students who have multiple registrations in a single term and the dates in the term are the same so there is no true date of sale or date the student registered there is only the date the term actually starts.

Below is every one of your formulas that I translated for my unique scenario. I basically want to see truly how many students in a given term are new because there is no registration for them within the last 365 days.

New Students =

VAR StudentTM = VALUES('WW Registrations'[Student ID])
VAR PriorStudents = CALCULATETABLE( VALUES( 'WW Registrations'[Student ID]),
    FILTER(ALL(Dates),
        Dates[Date] > MIN(Dates[Date]) - 'Churn Time Frame'[Churn Time Frame Value] &&
        Dates[Date] < MIN(Dates[Date]) ) )
    
RETURN
COUNTROWS(
EXCEPT(StudentTM, PriorStudents) )

New Student Registrations =

VAR StudentTM = VALUES('WW Registrations'[Student ID])
VAR PriorStudents = CALCULATETABLE( VALUES( 'WW Registrations'[Student ID]),
    FILTER(ALL(Dates),
        Dates[Date] > MIN(Dates[Date]) - 'Churn Time Frame'[Churn Time Frame Value] &&
        Dates[Date] <= MIN(Dates[Date]) ) )
                            
RETURN
CALCULATE( [Total Registrations],
    EXCEPT( StudentTM, PriorStudents) )

Continuing Students = [Unique Students] - [New Students]

I used my unique student formula because the All Students measure did nothing. But the Unique Student Formula seems to also do nothing. Unique Students = COUNTROWS( VALUES( ‘WW Registrations’[Student ID])) but it is the same formula as the All Students Formula just with a different name.

Lost Students =

VAR StudentRegistered = CALCULATETABLE( VALUES( 'WW Registrations'[Student ID] ),
                        FILTER( ALL( Dates ),
                            Dates[Date] >  MIN( Dates[Date] ) - 365 && 
                            Dates[Date] <=  MIN( Dates[Date] ) - [Churn Time Frame Value] ) )
VAR PriorStudents = CALCULATETABLE( VALUES( 'WW Registrations'[Student ID]), 
                        FILTER( ALL( Dates ),
                            Dates[Date] >  MAX( Dates[Date] ) - [Churn Time Frame Value] &&
                            Dates[Date] <= MAX( Dates[Date] ) ) )
RETURN
COUNTROWS( EXCEPT( StudentRegistered,  PriorStudents ) ) * -1
First just a note on formatting your DAX measures in posts - https://forum.enterprisedna.co/t/how-place-dax-formula-into-forum-topics-posts/156/3

When we jump to this sort of logic it gets complex fast.

Is it possible to just focus on one here.

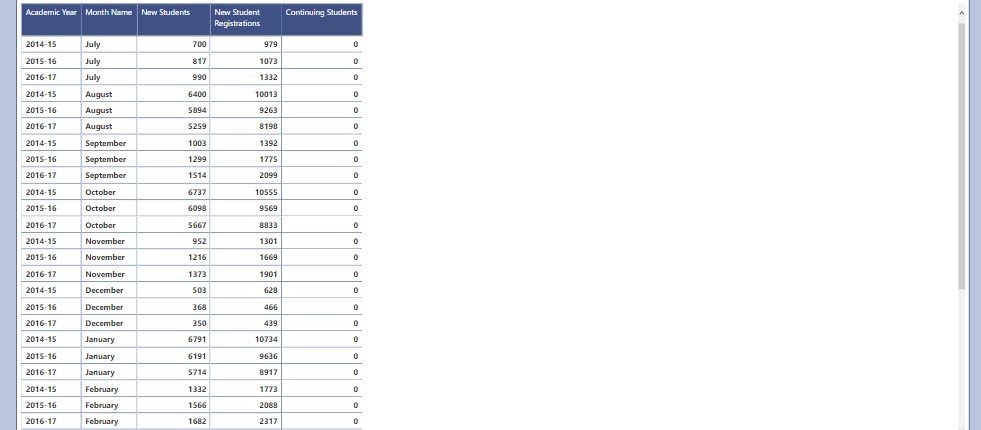
Which calculation would you like to look at. I can see Continuing students isn’t working? But the new students part of it is, so what’s unique students calculating?

Can we focus on the continuing student logic?

Here are a couple of things that make them a continuing student:

  • If they have more than one registration in an academic year

  • If they have at least one registration in the previous academic year and they also have a registration in the current academic year

An academic year is always defined as July 1 to June 30. I set up my dates table to adhere to this date structuring for a year based on the Dates code you provided for Power BI.

I picture a formula in my head that looks at the student ID and uses some IF logic that looks for registrations in the current and previous AY. The only system I accomplish such a task in was Sisense BI because it supported Multi-Pass Aggregated Analysis but since I am naturally using Power BI trying to think about what its equivalent would be is where I run out of steam.

The fatal mistake I made was not saving the Sisense BI formulas before leaving the platform.

Unique Students = COUNTROWS( VALUES( 'WW Registrations'[Student ID]))

So truly its giving me the unique student based on their ID number from the registrations table. So it captures all students whether they are new or continuing.

Can you show this in the table, as I don’t understand why this would be returning no results.

I’m looking at this formula here

Continuing Students = [Unique Students] - [New Students]

And then see the new students producing results. So something has to be wrong with either unique students, or they produce exactly the same result?

Then looking at new students.

What are you using as the churn time frame value? Maybe you need to hard code a number here for like 365 days or a year

Another way to break down the new student formula and see what it is calculating is to break out the variable into different measures and wrap them in COUNTROWS. Then you can evaluate those calculation individually to assess how they are working in a particular context.

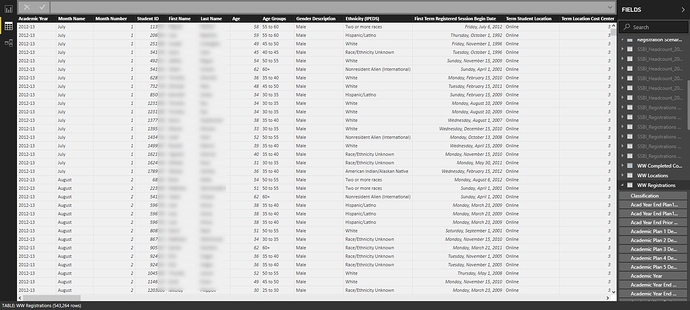
Below is a view of the WW Registrations table showing the Student ID Column. I had to blur out the information so that I do not violate FERPA.

My initial thought was that they are producing the same result. Truly the only way to break them out on any usable date is the Term Session Start date which is the field that is connected to Dates[Date].

Churn Time Frame Value is established as follows:

Churn Time Frame Value = SELECTEDVALUE('Churn Time Frame'[Churn Time Frame], 365)

Churn Time Frame is established as follows and I kept playing with the information to account for my longest scenario of a student potentially working through loopholes in the active status policy.

Churn Time Frame = GENERATESERIES(0, 730, 21)

In breaking down the new student formula are we saying a step to occur before the following:

New Students = 
VAR StudentTM = VALUES('WW Registrations'[Student ID])
VAR PriorStudents = CALCULATETABLE( VALUES( 'WW Registrations'[Student ID]),
    FILTER(ALL(Dates),
        Dates[Date] > MIN(Dates[Date]) - 'Churn Time Frame'[Churn Time Frame Value] &&
        Dates[Date] < MIN(Dates[Date]) ) )
        
RETURN
COUNTROWS(
    EXCEPT(StudentTM, PriorStudents) )

I am starting to think that because of policies that students circumvent I really have a scenario where its hard to break new students from continuing students and maybe I would only be able to break this by looking at a student who has an admitted date that is within 12 months of the term session start date.

This really is tough for me to audit without seeing the model and playing around with it. Mainly due to the formula being quite complex and and number of variable that could cause issues.

All I would highly recommend here is really dive into the formula and understand what it is doing at every result in the context it is place in.

The logic runs like this (this is if you have this at a monthly or daily context)

  1. Work out how many student are in the current context and create a table them uniquely
  2. Then create an entire table of student from the min data back the ‘churn time frame’
  3. Then compare which students appear in the current context but don’t appear anywhere in the backwards looking client table
  4. This leaves you with the students who are new in one table, and then count them up using COUNTROWS

That’s it.

Walk through this exact logic at every context you place this formula and then it will make a lot more sense.