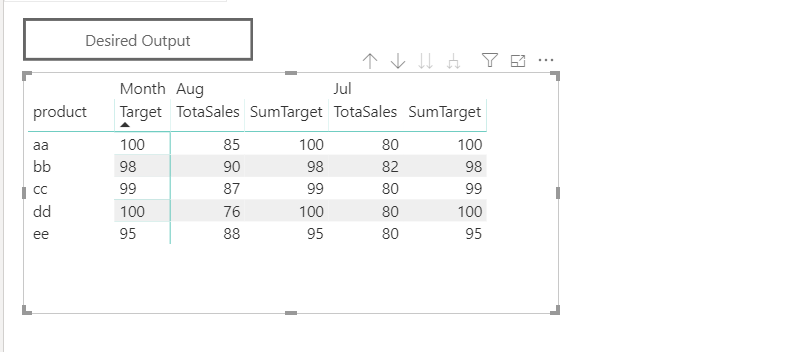
I am trying to add a new measure column in a Matrix visualization, but looks like it is not possible. I can add a new measure column if it is coming from the database, but If I use some logic and make a new measure, it does not allow me to add it to the Rows.
Enclosing a quick sample. In the sample I am able to add the Target object, but I need to add the SumTarget measure.tst.pbix (44.3 KB)
Does anyone knows how to add a measure column in matrix.
Unfortunately there’s just nothing else I can advise on this particularly.
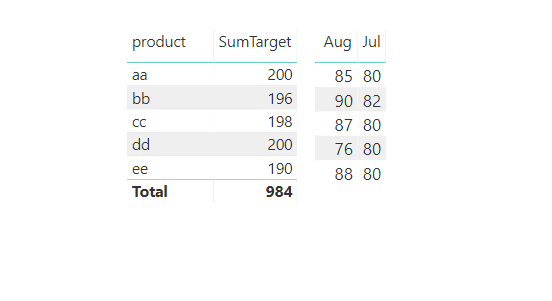
You other option is just to create two table/matrix side by side.
Here’s an example
I created a table for the sumtarget numbers, then with the matrix I just hide the row headers. Make sure word wrap is off in the column and row headers as well.
Thanks. Even I thought of creating 2 tables side my side. My only problem is , if I select the Product Column Header the sorting will change for one table, so the numbers won’t match up with the second table. Is there a way to stop the column sort click. I mean disable the column sort when clicked on the header.