Hi Guys,
I am trying to created a report which shows new and dropped accounts, the user requested that they would also like to see in which age buckets these new/dropped account are in. An age bucket is define by the account maturity date less the previous business day. I created this age logic on power query as a calculated column. Then I created another column with the buckets as follows:
Buckets = SWITCH(TRUE(),Age[Value] < 91,“0m - 3m”
,Age[Value] < 182,“3m - 6m”
,Age[Value] < 365,“6m - 12m”
,Age[Value] < 730,“1y - 2y”
,Age[Value] < 1095,“2y - 3y”
,Age[Value] < 1825,“3y - 5y”
,Age[Value] <= 3650,“5y - 7y”
,Age[Value] > 3650,“Over 10y”
,“N/A”)
I then created a measure that takes compares two dates DTC = Current Date and DTP = Previous Date, which are selected by a user via a filter, then does an EXCEPT using the transaction IDs between current date and previous date.
#TxnInCurrNotInPrev = VAR dC = [#DtC]
VAR dP = [#DtP]
RETURN
COUNTROWS (
EXCEPT (
CALCULATETABLE (
VALUES ( ‘TableName’[TXN_ID] ),
‘Date’[BusinessDate] = dC
),
(
CALCULATETABLE (
VALUES ( ‘TableName’[TXN_ID] ),
‘Date’[BusinessDate] = dP
)
)
)
)
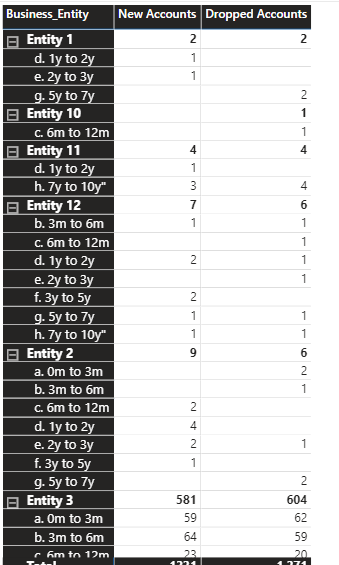
This works perfectly however when I add the Age Bucketing into the Matrix I also see values for transactions that have moved between buckets through maturity i.e. moved from being 90 days old (in the 0-3m bucket) to being 91 days old (in the 3m - 6m bucket) and the users actually want to see only the truly new customers i.e. Didnt exist at all previously but now exists in the current date’s dataset.
IN the attached screengrab you will see that at a Business Entity level we have a correct new customer count of 1 customer but if I add a drilldown of the age buckets i get 3,1,2,2 in various buckets.
Can you please assist.


