Hi
I need some help on how to programme a new meassure or table/column.
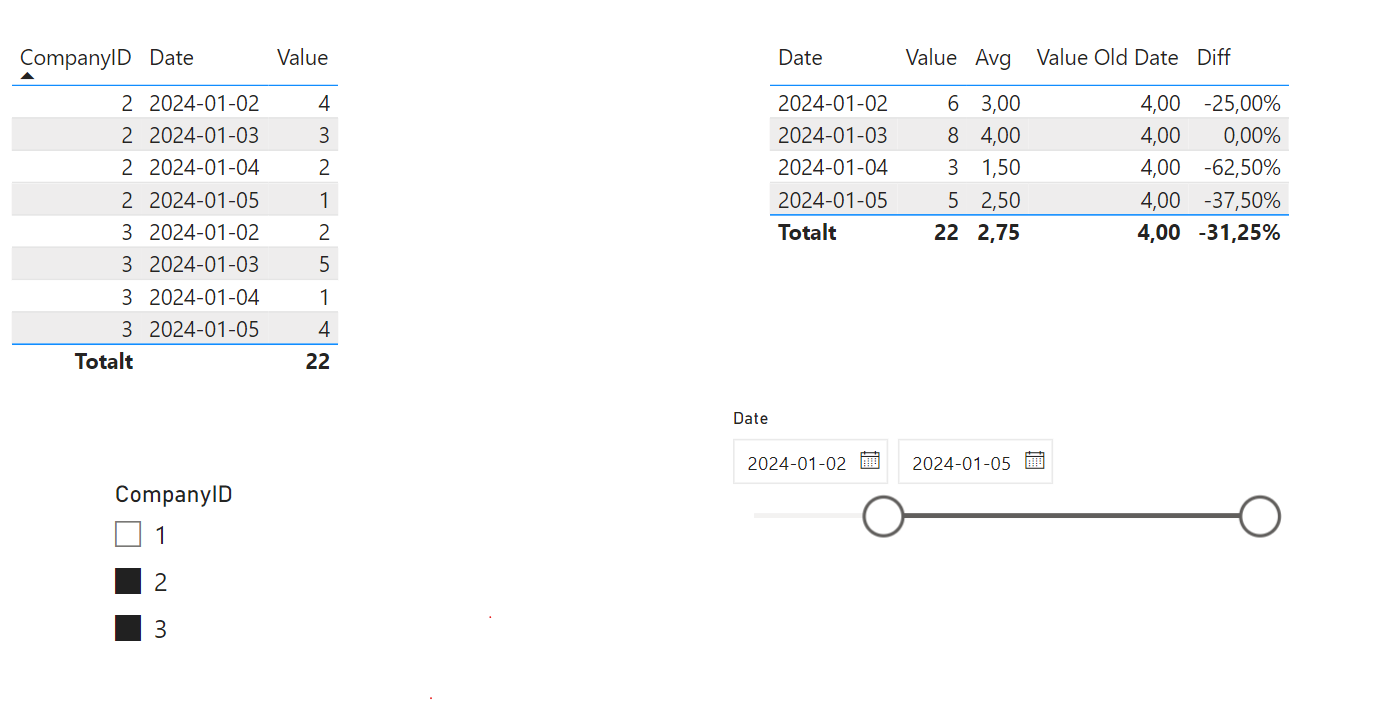
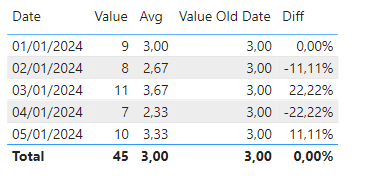
I have a table with the columns named CompanyID, Values and Date. I would like to calculate the difference in percentage between the average of values for the oldest date for each row. I have no problem creating it in Excel but I want to use it in Power bi together with a slider for CompanyIDs and Dates. Expecting the result is the orange coloured table.

/Christian
PercentDiff.pbix (54.6 KB)
Welcome
See if it helps
PercentDiff.pbix (54.0 KB)
Thanks alot for the help!
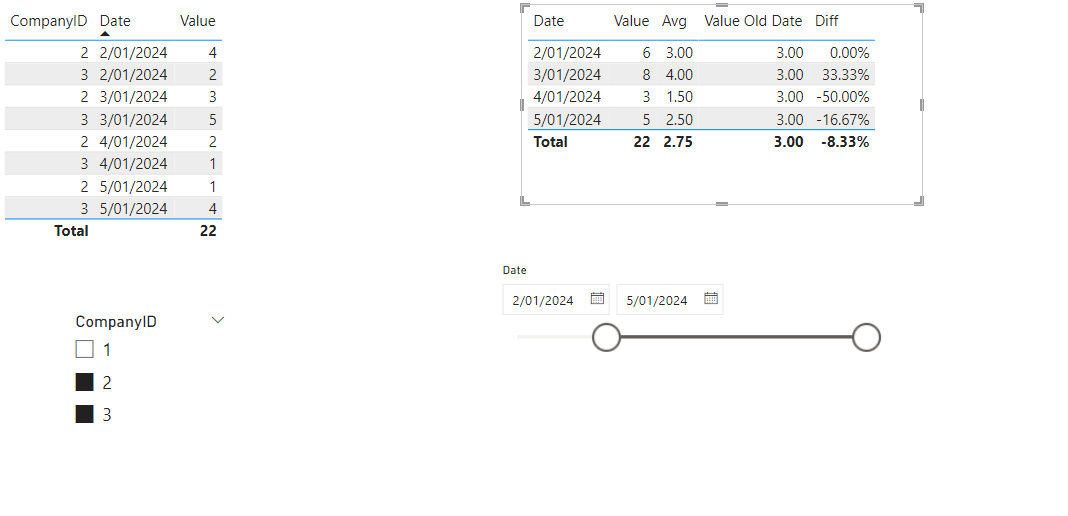
It almost works as I described. Only issue is that if I add two slicers, one for the CompanyID and one for the Date the recalculation only works for CompanyID. When filtering the date it does not update “Value Old Date”. It only removes the line from the table. Diff % should always be 0 at the first line for the oldest selected date.
In the picture “Value Old Date” should be the average for oldest selected date which is 2024-01-02 with values 4 and 2. “Value Old Date” = (4+2)/2 which is 3 and therefore the diff % = 0.
Glad if you have the time to take one more look at this.
PercentDiff.pbix (55.2 KB)
Hi @christian.ahlstrom ,
I think if you just change ALL to ALLSELECTED, it should work.
Value Old Date =
VAR Var1 =
CALCULATE ( MIN ( MyTable[Date] ), ALLSELECTED ( MyTable ) )
RETURN
CALCULATE ( [Avg], FILTER ( ALL ( MyTable[Date] ), MyTable[Date] = Var1 ) )
Kind Regards,
Hafiz
Thank you Hafiz
By using ALLSELECTED it works.
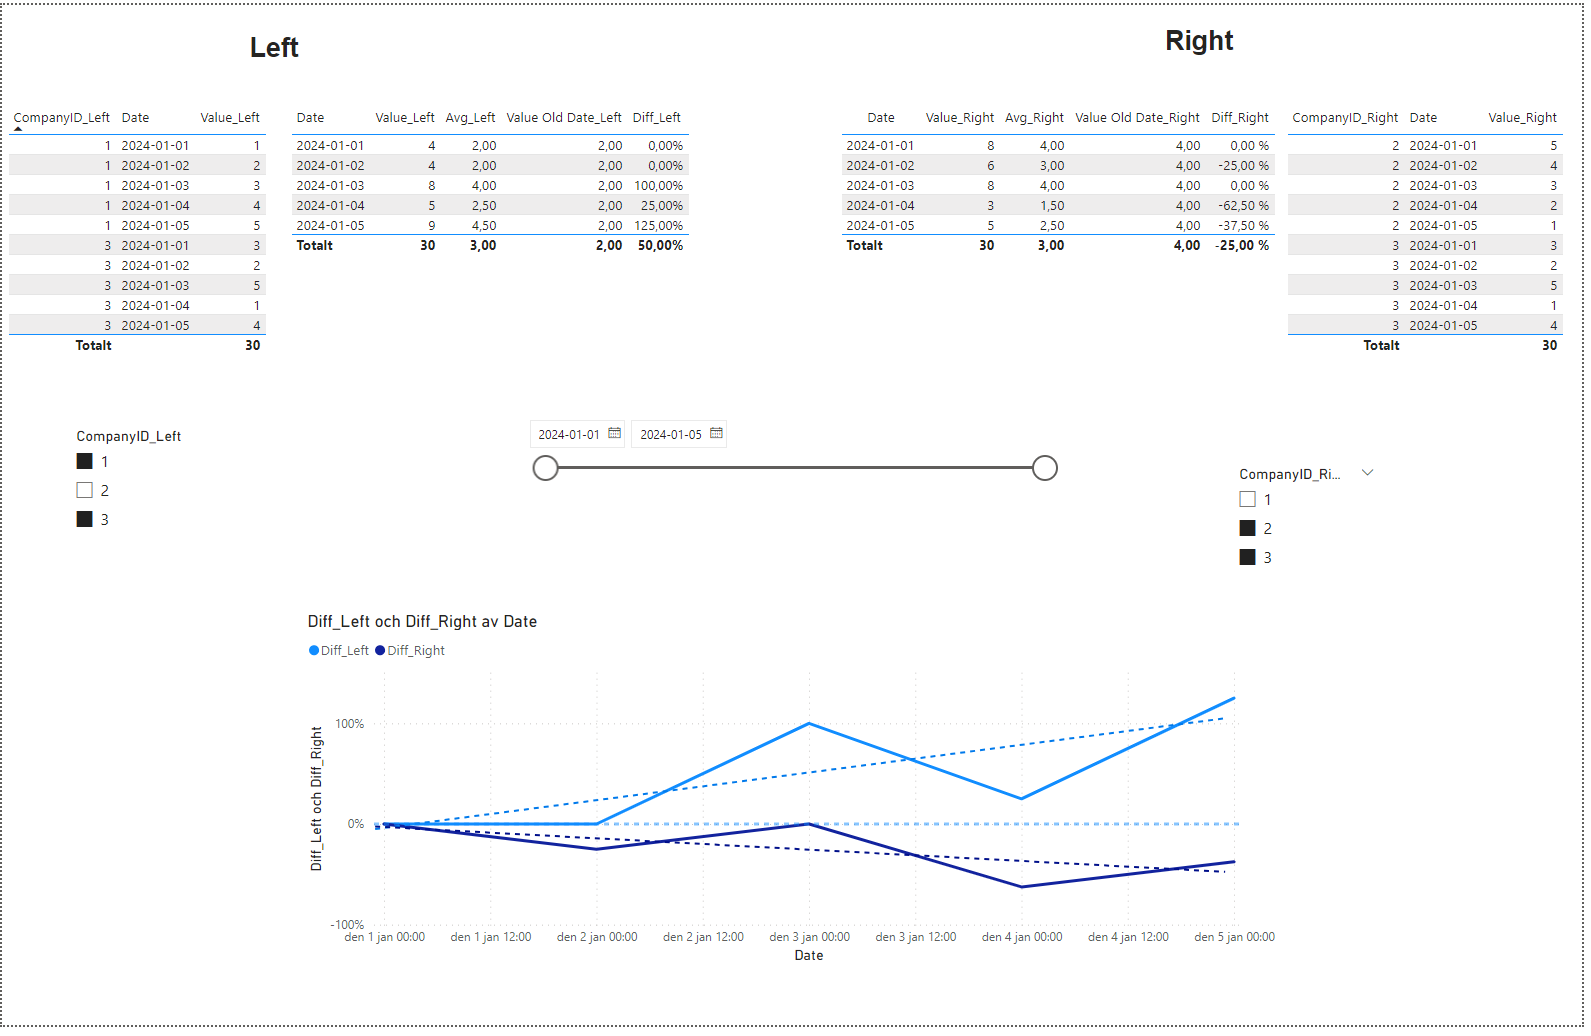
One more issue. From the request above I have created double of everything and put the results into a chart. I need to calculate moving average for the two values diff_Right and diff_Left.I only have values for 5 days in the table so maybe MA2 would be posible. The quick meassure does not manage.