Hi everyone,
First all, always a big thanks to everyone since the platform is great and you helped me once already.
I am facing a new challenge right now: I have a dataset that I retrieved from SQL than groups my customers by monthly cohort e monthly activity. I have also managed to calculate already the number of customers in each monthly cohort.
This is what I got so far:
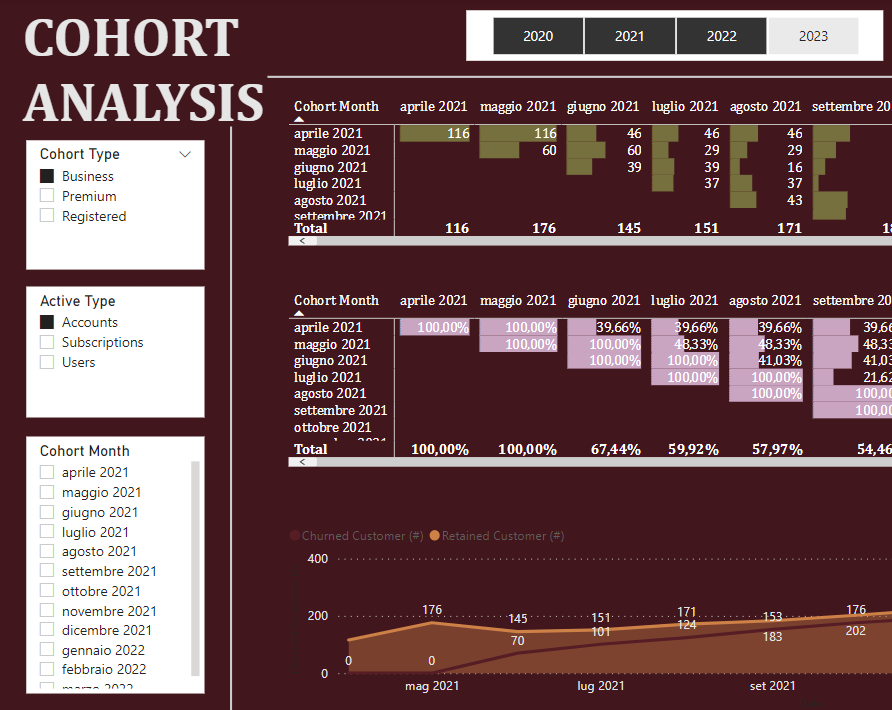
The first matrix shows a classical cohort analysis where I put in rows the monthly cohort already grouped in SQL and in column the activity cohort as subsequent periods. All work well.
The second matrix shows the retention rate per cohort and also here everything looks good
Now what I would like to achive is splitting the retained customers between “New” and “Retained”. At the moment they are blended together. Let me explain thru an example: lets consider June (I am using the PBIX file on my Italian laptop: that is why the header is in Italian, apologize for that):
The total customers in June 2021 is 145: 46 as retained from April + 60 as retained from May + 39 as “New”. Now if you look at the area chart at the bottom, again I want to isolate these 39 customers as the “real new” because I want to include and count as new only the ones that purchased in June for the first time.
I have watched the videos on this topic but my data set has a different level of granularity and I am stuck.
Would you be able to help me out?
Attached the data set (I have masked the data so everything should be good to be used)
Many thanks
DataSet.xlsx (26.1 KB)