I have all the dax as per the workshop on customer analytics - works great - thanks.
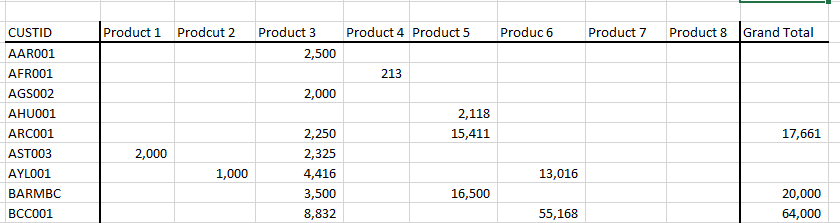
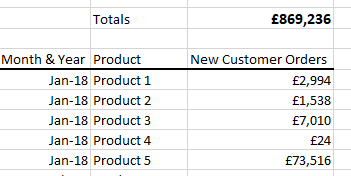
I’d like to be able to analyse what the customer actually bought . If I simply pull the product name into the analysis the numbers then don’t work - I assume this is because I don’t have any reference to product in the virtual tables?
Can you possibly add some images of the results you are getting? That would make it easier to understand the behaviour of the formula.
If you add the product filter to the formula here it should break the results down per product, so I’m confused there.
If you want to look at what each customer is buying specifically this formula isn’t really going to help you. You would just require a different table/visual with product name as the context and then just total sales.
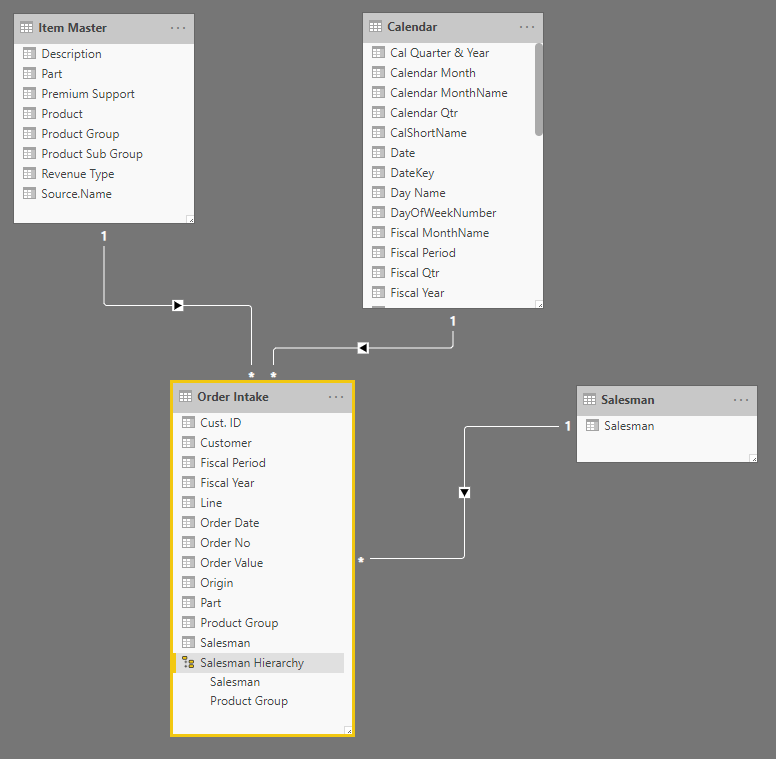
Will probably need to understand more about the setup you currently have here (images would be helpful) to really help.
Would have to see the model here, as it could be many things.
One thing to note here is your really jumping in the deep end. This is some of the most advanced DAX you can do.
I detail the technique extensively here
And also here (check out the resource that can be downloaded here as well)
You also shouldn’t really be using this formula everywhere like it looks like you are doing.
DAX formula react very different depending on the context is which you place them it. This formula specifically has been created to work with a date context so over time you can see who are new versus who aren’t.
If you just want to see the products then you’ll want a different formula most likely.
Other than this I would need to see more (as in the model) as it’s difficult to give you a definitive answer from what I’m seeing still.
It comes down to understanding context quite deeply on these.
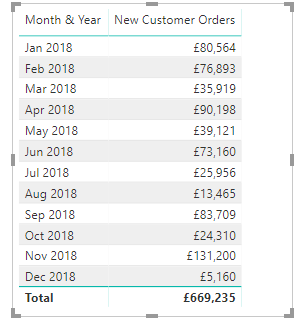
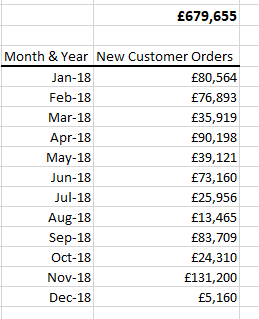
If we forget about product and just stick to date context ie as per your videos … that doesn’t appear to work either in that when looking at month and year context the total is not the addition of the months?
You mention it could be various things - What areas should I be looking at to check?
The orders table seems very basic and linked to a standard dates table.
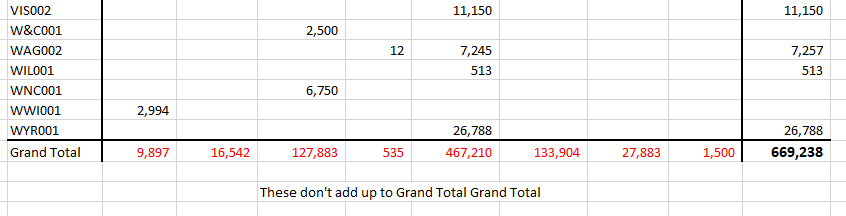
I’ve checked on the New Customer Analysis Pack and the same applies. The total doesn’t equal the addition of all the values when state and Month & Year are included.
In the context what does that Total represent?
You are taking a set of customers with no context (which mean every single customer from the beginning of time) then comparing that to a customer set between a certain set of dates (which is created by the FILTER logic above)
This is complex as I mentioned earlier, so without actually seeing and testing a demo it’s hard to give you an exact solution here.
By how I originally set up this formula against the month and year context the total was irrelevant to me because I just wanted to show it by month. The reality is the total is pretty irrelevant in a data and time context and what does the total actually give you as an insight. I personally can’t really see one when it that context. In another context maybe, but the formula would likely need to be reworked for that.
If you can create a demo scenario that can work on, that would be helpful.