I have a question regarding the new customer formula in the Scenario method workshop. I understand the logic of the formula from a monthly context but could you help me understand how the formula works on a yearly context.
For example, if I apply the same formula to the cumulative year 2018 (not broken down by months),
is the formula … Going to compare a table with the entire 2018 customer list with a table of customers in the 3 month priors to 2018 (Oct, Nov, Dec).
(OR)
does the formula in essence goes through each month with the monthly logic you mentioned in the video and then returns an average of new customers?
Any help is much appreciated. Just trying to understand if this formula works for a yearly context as well.
I believe your first point and thinking is what would occur due to the way the formula is setup to iterate over days from memory.
So you would likely want to adjust these formula slightly for a yearly context.
If you’re still not sure then recommend placing some images and then it will be easier to assess exactly, but I’m pretty confident you’re correct on your first point
The Video: New Customer Analysis with Power BI - April 2018 in above modul.
I have been playing around with the number of days.
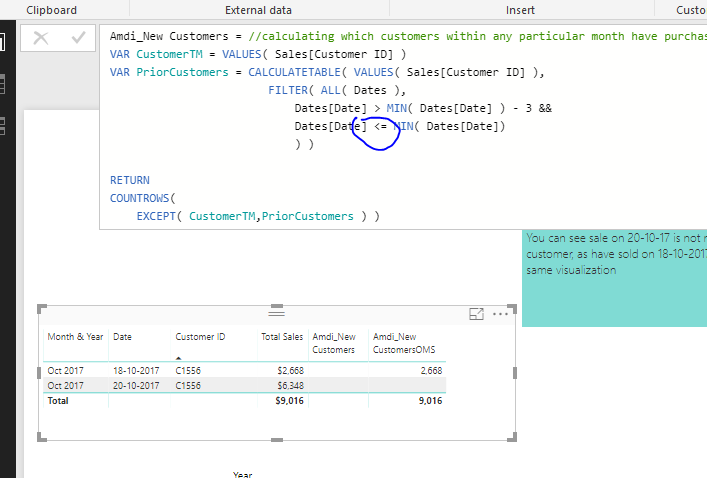
I experienced. Ex on rows Date and Customer ID and then the formula.
Days inserted directly in the formula with 3 days.
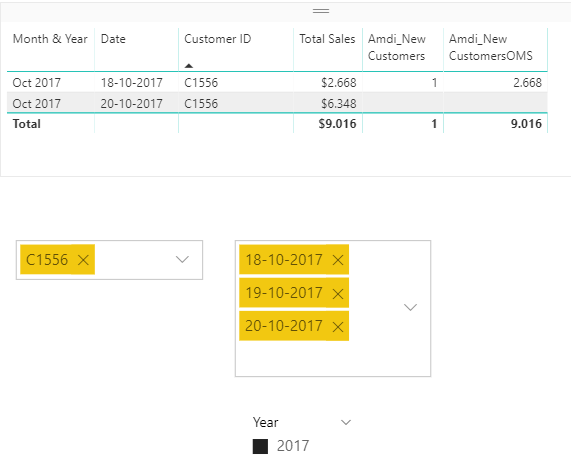
The visualization have sales on the same customer ID.
18-10-2017, This is indicated as sale to a new customer
20-10-2017, The formula for new customer is blank. Because it has been sold on 18-10-2017, which is within the days of interval of 3 days. Therefor it’s not a new customer on 20-10-2017.
In the same visualization, the same customer for two different status. New and Old.
Was this the intention ?
I would prefer that the days back is counting back from the oldest day in the visualization. But I can’t find out of that.
Hi Sam
Thank you for your answer. I have played around when the sign is <=. If there is a sale on a customer then with the sign <= it will always take it self into the calculation, and will always be a prior customer. It help me to think in an other way.
After have been thinking a lot on your metode, I like it and understand and can see the meaning with it now.
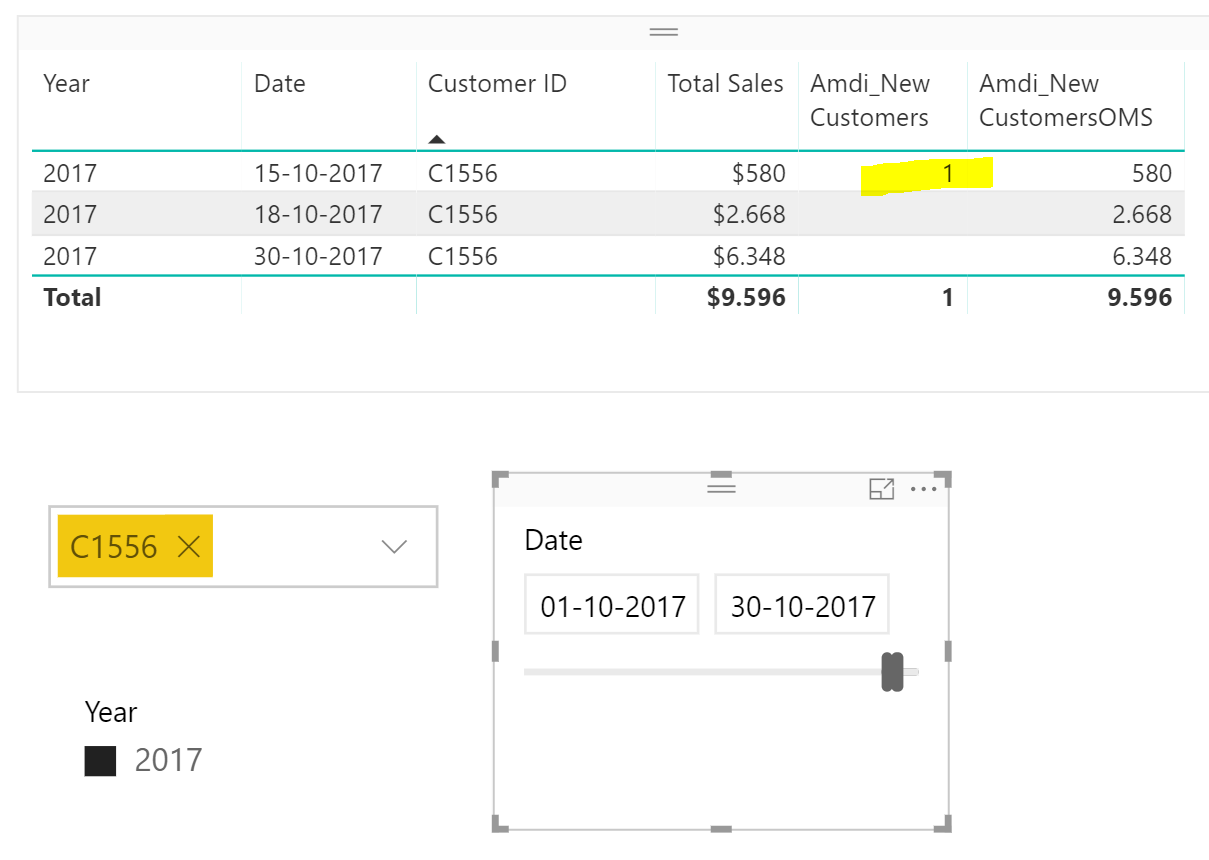
Ex. the visualization with row levels Date(date) for October and Custom. Set to 30 days to look back in time. For every row of Date(date) it will look backwards 30 days. In that case it will only be the first sale to the customer ID which will be new customer. The other one to same customer ID, is not new in October.
I prefer the text as: First sale to new customer.
I wrote above, if it could help some other instead of struggling with it as I have.