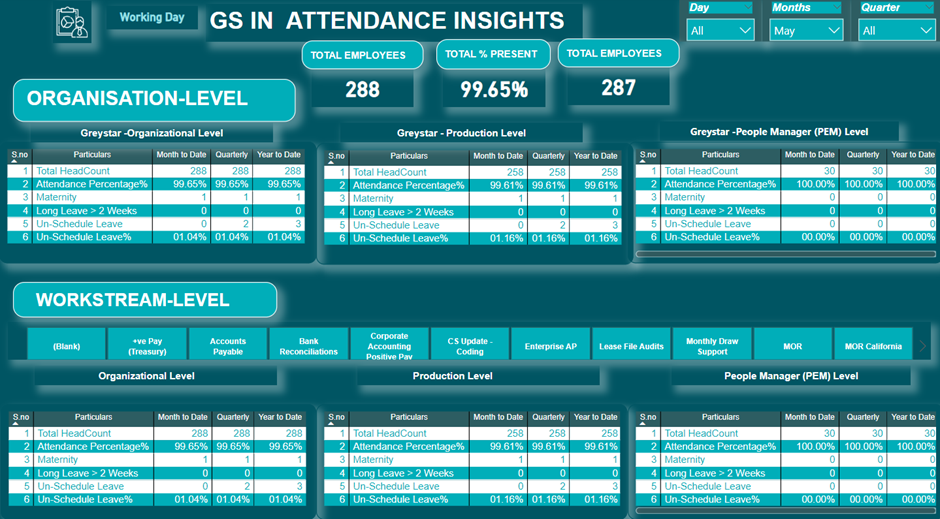
As I must make the below calculation like I need the data as per MTD, QTD & YTD however when I select the full month, I does not show me different in MTD, QTD & YTD.
As you can see in the below screenshot when I have selected the May month in MTD Column it shows me for April, As Quarter also started It should also be added for April, May Data because as quarterly column shows the cumulative total of April, May & June.
yearly Column shows me Jan to Dec data total.
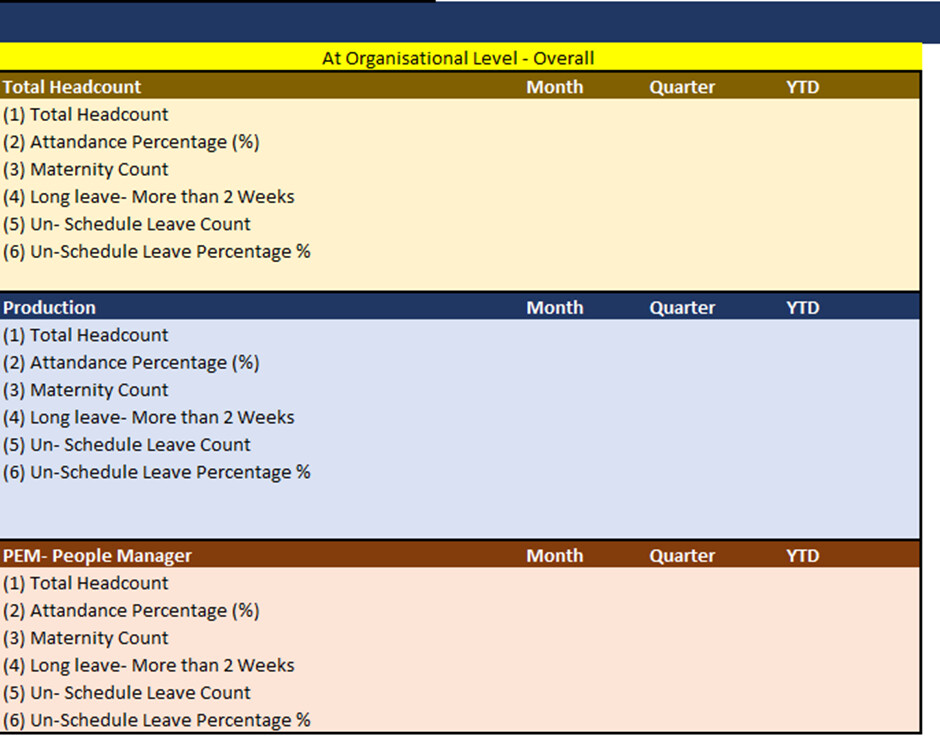
As you can see, I need the data as per below criteria. Please see where my Dax function is wrong.
If anyone can help me in this that will be highly appreciated.
I also attached the raw data file & my working file your reference
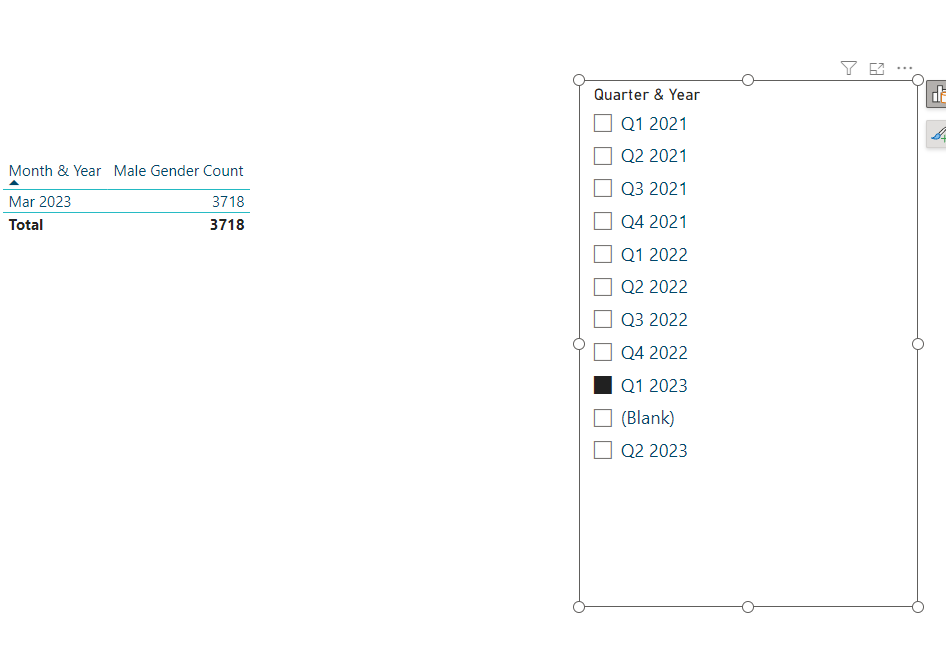
I would use the Extneded Date table. It will have all the parameters you need in order to do time intelligence. I added it for you and created a measure called “Gender Count” on page 2 so you can see how it works.
Hi Team,
Could you please look into above scenerio case studies, I have attendance data & I need to visulization as per above. Could you please let me know how I can do this.
Hi @hmalhotra2020 - I have looked into the file. The issue is as you are using DISTINCTCOUNT like DISTINCTCOUNT(Attendance[Employee ID]) in your measures. And if we take the Distinctcount in data, it is always 288 for Month, Qtr and Year.
Can check the difference by using Count instead of DistinctCount in attached file (check measures with Ankit). Let me know if further help is needed.
Due to inactivity, we’d like to conclude that you no longer require assistance to solve your inquiry.
If you have a follow question or concern related to this topic, please remove the Solution tag first by clicking the three dots beside Reply and then untick the check box.